S&P 500 LinkUp Jobs Index movement
We just published LinkUp’s 2020 Jobs Report [COVID impact on labor demand], within which we explore the impact of the coronavirus pandemic on labor market conditions, as well as how jobs and industries have shifted in response and how far …

We just published LinkUp’s 2020 Jobs Report [COVID impact on labor demand], within which we explore the impact of the coronavirus pandemic on labor market conditions, as well as how jobs and industries have shifted in response and how far we’ve traveled on the road to recovery.
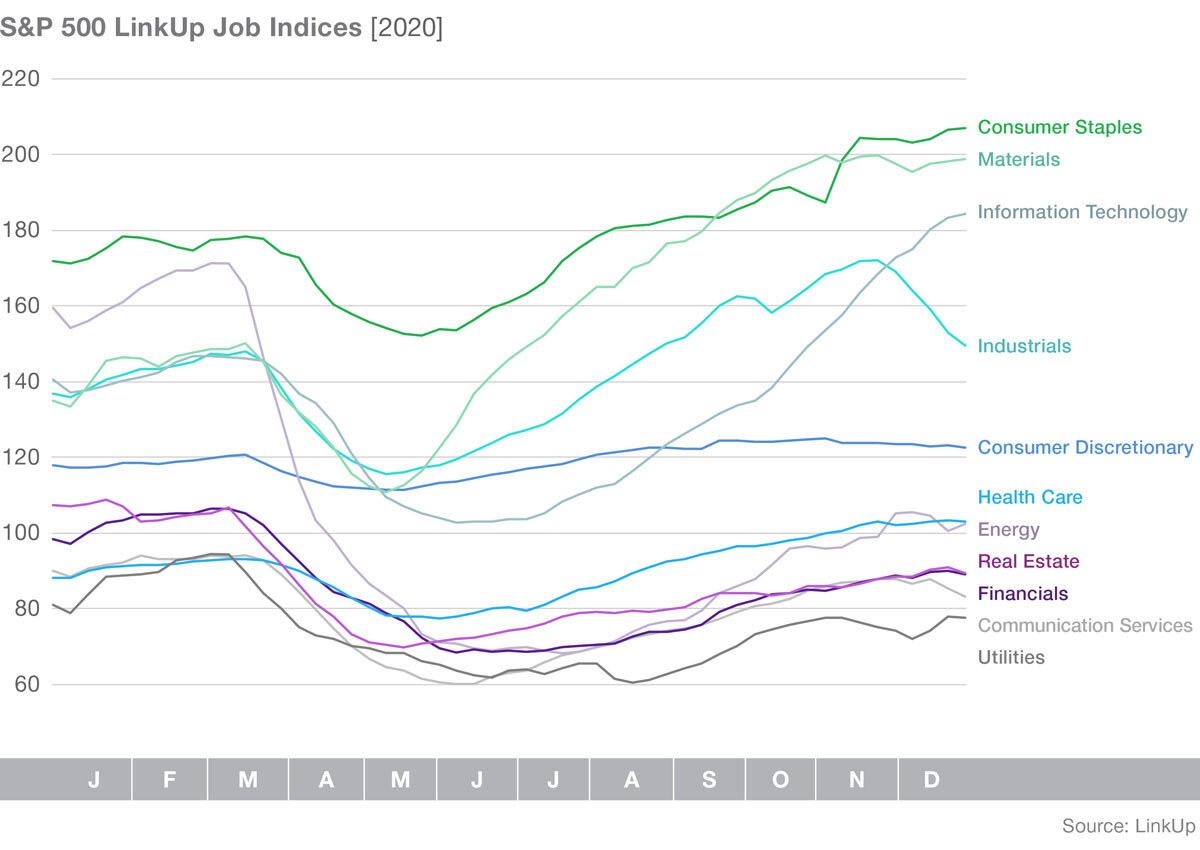
In this new report we also showcase our S&P 500® LinkUp Jobs Index and share a graph of how each sector index changed last year.
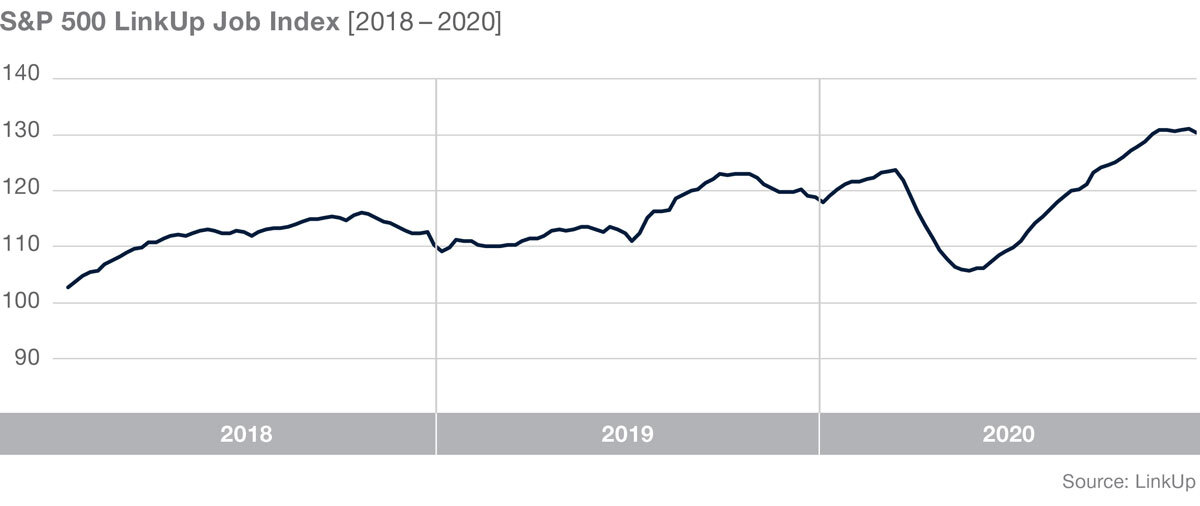
We also wanted to take a deeper look at the index, as well as give it some additional perspective. To do this, we took a look back at the last few years:
- % change in 2018: 7.47%
- % change in 2019: 7.69%
- % change in 2020: 9.72%
Overall, the change in the last 3 years has been positive, with a total growth of 26.98%. Take a look:

Yet the S&P 500 LinkUp Jobs Index, much like our jobs index as a whole, saw stark losses beginning in March 2020. From March 16 to June 10 the COVID declined caused the index to drop 14.2%. However the index later ended the year at a level higher than it began in January 2020, up 9.7% in 2020 overall. That surpasses the growth of the LinkUp job index as a whole, which in comparison saw a 7.5% drop in active job listings over the same time period.
When we look at the sector indices, we are able to see which are driving the aforementioned growth:

Materials saw impressive growth reaching almost 50%. The Energy sector experienced the most substantial declines at -35%, much higher than the next closest sectors Real Estate and Financials down 17% and 10% respectively.
The S&P 500 LinkUp Jobs Health Care Index was 4th on the list of sectors with the most growth, with a 17% growth in job listings in 2020. Take a look at how each sector stacks up:

We will continue to monitor the index to see how things shift and change in 2021. For more on some of the company tickers we’re watching (the companies with the most job growth in 2020), download the full LinkUp 2020 Jobs Report.
About the index
The S&P 500 LinkUp Jobs Index measures labor demand for the S&P 500® at an aggregate level as well as at the GICS sector level. The index provides insights into the overall performance of the companies and sectors represented by the S&P 500. And because job openings from the companies in the S&P 500 represent roughly 15% of the total job openings in the U.S., the index is highly correlated to and predictive of non-farm payrolls, unemployment, and the general health of the economy as a whole.
Insights: Related insights and resources
-
Blog
12.10.2021
November 2021 Jobs Recap: a substantial slowdown with far fewer job listings
Read full article -
Blog
02.11.2021
Insights from our 2020 Jobs Report [COVID impact on labor demand]
Read full article -
Blog
05.06.2019
The S&P 500 LinkUp Jobs Index
Read full article
Stay Informed: Get monthly job market insights delivered right to your inbox.
Thank you for your message!
The LinkUp team will be in touch shortly.
