September 2023 Jobs Recap: Labor Market Analysis
Looking at our jobs report today, the U.S. job market encountered a drop in total job listings, indicating a slowing job market heading into Q4.


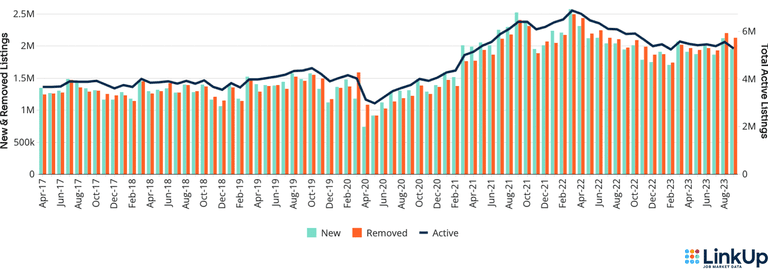
In September, job listings decreased in every U.S. state, resulting in a 5.1% decline in active job listings compared to the previous month’s job data. Created job listings were also down 8.1% signaling a labor market cooldown. However, new jobs have gone up and down in the past four months, but overall there has been little change in the job market. In September there was a 3.3% decline in removed job listings, which shows positions were filled or removed by the company without being filled. Below, we’ll break down the job market data further.
U.S. Job Listings by Month | Jan 2020 - September 2023
CLOSED DURATION
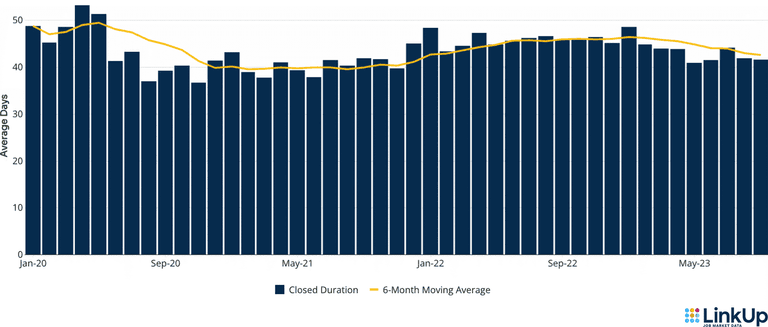
The entire U.S. economy tracks hiring velocity by measuring closed duration, or the average number of days that companies post job listings on their websites before removing them. As the average number of days a job listing remains live increases, hiring velocity slows.
On average, it took 41.6 days for a job listing to be removed from a company website in September. There was almost no change compared to August’s average of 41.8 days.
Closed Duration of U.S. Jobs | Jan 2020 - September 2023
JOBS DATA BY STATE
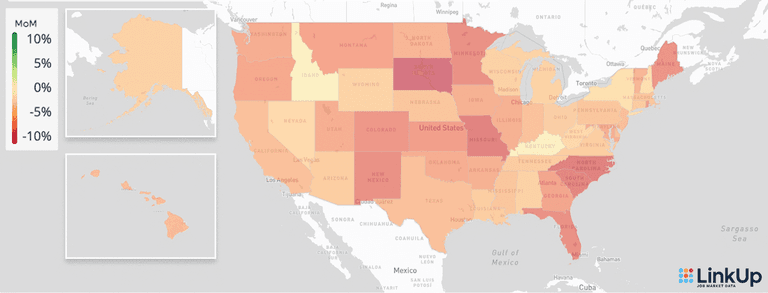
Every U.S. state experienced a downtrend during September, which is reversed from last month’s data. The states that saw the largest decreases in job listings included:
District of Columbia (-9.1%)
South Dakota (-9%)
North Carolina (-8.3%)
Missouri (-8.1%)
South Carolina (-7.9%)
% change in active job listings (month-over-month) | September 2023
JOBS DATA BY INDUSTRY (NAICS)
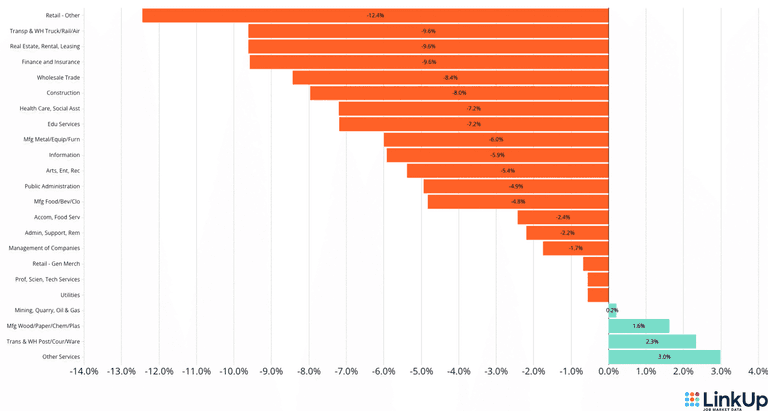
83% of U.S. industries encountered a decrease in job listings during the month of September. Overall, the retail industry experienced the biggest decline in job listings of 12.4%, with a few other industries trailing closely behind which included:
Transportation & Warehousing Truck/Railroad/Air (-9.6%)
Real Estate, Rental, and Leasing (-9.6%)
Finance and Insurance (-9.6%)
The few industries that went through a small increase in job listings this September included:
Other Services (+3.0%)
Transportation & Warehousing Postal/Courier/Warehouse (+2.3%)
Manufacturing Wood/Paper/Chemicals/Plastics (+1.6%)
Job Listings by Industry (NAICS) | September 2023
JOBS DATA BY OCCUPATION (O*NET)
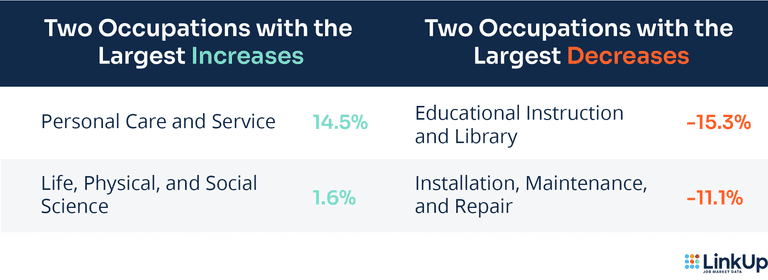
90% of all occupations in our database saw a decline in September. Only two occupations saw an increase in the current job market, which were Personal Care and Service (+14.5%) and Life, Physical, and Social Science (+1.6%). Otherwise, the two occupations that had the largest decline were Educational Instruction and Library at 15.3% and Installation, Maintenance, and Repair at 11.1%.
LINKUP 10,000
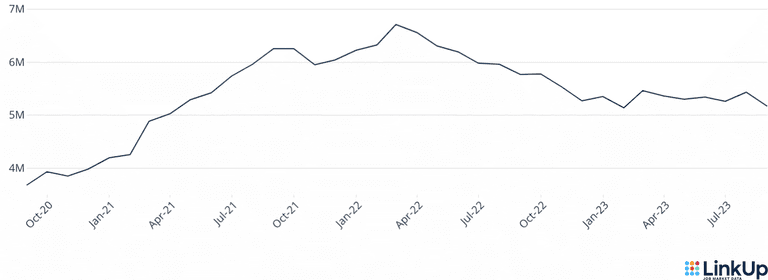
The LinkUp 10,000 is a daily and monthly analysis that shows the number of job openings from 10,000 global employers with the most U.S. job openings in LinkUp’s dataset.
Based on LinkUp's job database, the 10,000 global employers with the most U.S. job openings, there were approximately 5.16 million active job listings in September, which was down 5.0% compared to August 2023. Overall, from this time last year the LinkUp 10,000 has declined by a total of 10.4%.
Monthly LinkUp 10,000
S&P 500 LINKUP JOBS INDEX
The S&P 500 LinkUp Jobs Index measures open jobs posted by the companies in the S&P 500 and is published on the S&P website. It can be viewed in aggregate or by sector.
Over the past four weeks, the S&P 500 LinkUp Jobs Index indicates that there was a 1.2% increase in listings. The sectors with the most gains included:
Information Technology (+6.4%)
Utilities (+6.4%)
Industrials (+3.6%)
Only three sectors experienced a decline in job listings. Those sectors were:
Health Care (-1.8%)
Real Estate (-1.8%)
Financials (-0.2%)
LinkUp S&P 500 Index

COMPANIES ADDED
LinkUp began collecting job listings on 1,006 new companies during September 2023; an 850% increase from September 2022. Every month new companies added to LinkUp data have been steadily increasing with the current 6 month moving average currently at 772 vs 213 as of one year ago. Contact us if you are interested in obtaining a complete list of companies that have recently been added. |

LINKUP MONTHLY FORECASTS
Stay tuned for our monthly forecast of the BLS JOLTS report next Wednesday which is available before the Bureau of Labor Statistics (BLS) posts their JOLTS data. The data includes estimates of the number and rate of job openings, hires, and separations for total jobs from private employers, by industry and by establishment size class.
Each month before the BLS, we also post our nonfarm payroll report forecast based on our LinkUp Job Market Data. The NFP report is based on total U.S. job vacancies and provides insight into anticipated growth or decline in job listings.
DATA DISCLAIMERS
LinkUp’s monthly data recaps incorporate revisions to previously-reported monthly data with the purpose of reporting the most accurate and up-to-date data points. For more information on what circumstances may impact data revisions, visit our Data Support Center.
Insights: Related insights and resources
-
Blog
10.03.2023
LinkUp Forecasting Net Gain of 105,000 Jobs in September - Below Consensus Estimates
Read full article -
Blog
09.13.2023
LinkUp's August 2023 JOLTS Forecast
Read full article -
Blog
09.06.2023
August 2023 Jobs Recap: Labor Market Analysis
Read full article
Stay Informed: Get monthly job market insights delivered right to your inbox.
Thank you for your message!
The LinkUp team will be in touch shortly.
