Released: Q1 2022 Economic Indicators Report
In the Q1 2022 edition of our quarterly Economic Indicators Report, we see accelerating job listing growth, growth across all industries, and increased job duration. Overall active job listings in Q1 were up 3.7% compared to Q4.

In Q1, duration (the amount of time a job stays on a company career site) increased by 10 days compared to Q4, that’s a 20% increase. Job duration has fluctuated through the past pandemic years, with a low occurring in Q1 2021 at 50 days. The 64 days, on average, it takes to fill open positions today, might be feeling rough for employers, but it actually is the same we saw pre-COVID.
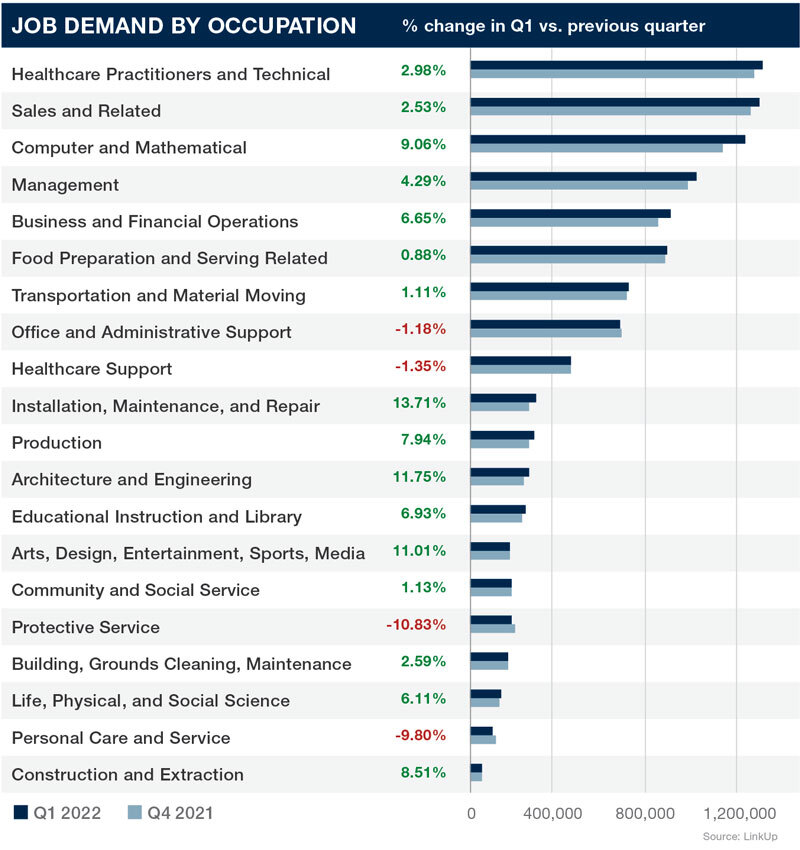
At the occupation level, some types of job listings did decline. Protective Services jobs decreased almost 11%, and Personal Care and Services jobs declined almost 10%.

Occupations with high growth include: Installation, Maintenance, and Repaid (+13.7%); Architecture and Engineering (+11.8%); and Arts, Design, Entertainment, Sports, and Media (+11.0%)

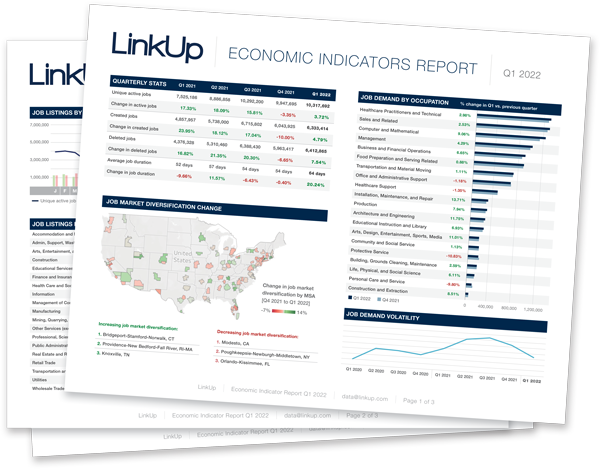
See the increasing momentum of job listing growth in more detail please download our free quarterly Economic Indicator Report [Q1 2022]. It includes quarterly and monthly job data, labor market graphs, charts, maps, and more.
↘ To receive new job reports directly in your inbox, subscribe!
Insights: Related insights and resources
-
Blog
07.28.2022
Q2 2022 Economic Indicator Report: Labor market slowdown
Read full article -
Blog
02.03.2022
Insights from our Q4 2021 Economic Indicators Report
Read full article -
Blog
08.05.2021
Just released: Economic Indicator Report Q2 2021
Read full article -
Blog
01.26.2021
Just released: Insights from our Q4 2020 Economic Indicators Report
Read full article -
Blog
11.19.2020
Insights from our new Economic Indicators Report: Q3 2020
Read full article
Stay Informed: Get monthly job market insights delivered right to your inbox.
Thank you for your message!
The LinkUp team will be in touch shortly.
