Q3 2023 Economic Indicator Report Released
With Q3 behind us, we’ve published our Economic Indicator Report. This US economy jobs report looks at labor demand at a macro level.

From Q2 2023 to Q3 2023, the average number of active job listings remained almost unchanged at 1.0%, which was roughly 9.34 million listings in Q2 to 9.43 million in Q3. On average the number of days it took for a job listing to be removed from a company website was 42.4 days. A minor change compared to last quarter (+1.0%).
View our monthly jobs recaps if you’d like to see month-to-month job market analytics.
U.S. Job Listings by Month | Jan 2020 - September 2023

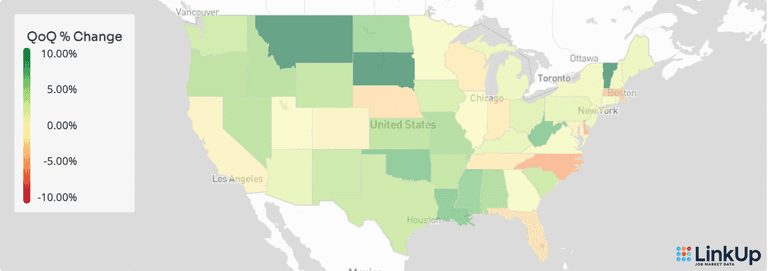
Job Demand by State
In Q3, 74% of the U.S. states experienced an increase in labor demand. States with the most growth included Vermont (+21.4%), South Dakota (+14.5%), and Montana (+12%).
% change in active job listings (quarter-over-quarter) | Q3 2023

Job Demand by Industry and Occupation
LinkUp job data by industry shows 58.3% of industries increased in labor demand. The industry with the most growth during Q3 2023 was Transportation and Warehousing (Truck, Railroad, Air) with a 39.3% increase in job listings. 47.6% of occupations increased in labor demand. The two with the most growth were Personal Care and Service (+14.8%) and Food Preparation and Serving Related (+11.3%).
Download the Q3 2023 Data
Download the Q3 2023 Economic Indicator Report to explore all the U.S. labor market analytics.
To receive new job reports like this directly in your inbox, subscribe!
Insights: Related insights and resources
-
Blog
07.12.2023
Q2 2023 Economic Indicator Report Released
Read full article -
Blog
04.19.2023
Q1 2023 Economic Indicator Report Released
Read full article -
Blog
02.01.2023
Q4 2022 Economic Indicator Report Released
Read full article
Stay Informed: Get monthly job market insights delivered right to your inbox.
Thank you for your message!
The LinkUp team will be in touch shortly.
