LinkUp Forecasting Mildly Disappointing July Job Gains; LinkUp 10,000 Hinting That Trade Policy Is Starting To Dampen Labor Demand
Having just recently traversed the halfway point of the year, I thought it would be a good time to look at our YTD NFP forecasting results and assign ourselves a mid-term grade. Luckily, with our forecast last month for stronger …

Having just recently traversed the halfway point of the year, I thought it would be a good time to look at our YTD NFP forecasting results and assign ourselves a mid-term grade. Luckily, with our forecast last month for stronger than expected job gains in June, we clawed our way back to a .500 batting average for the year.
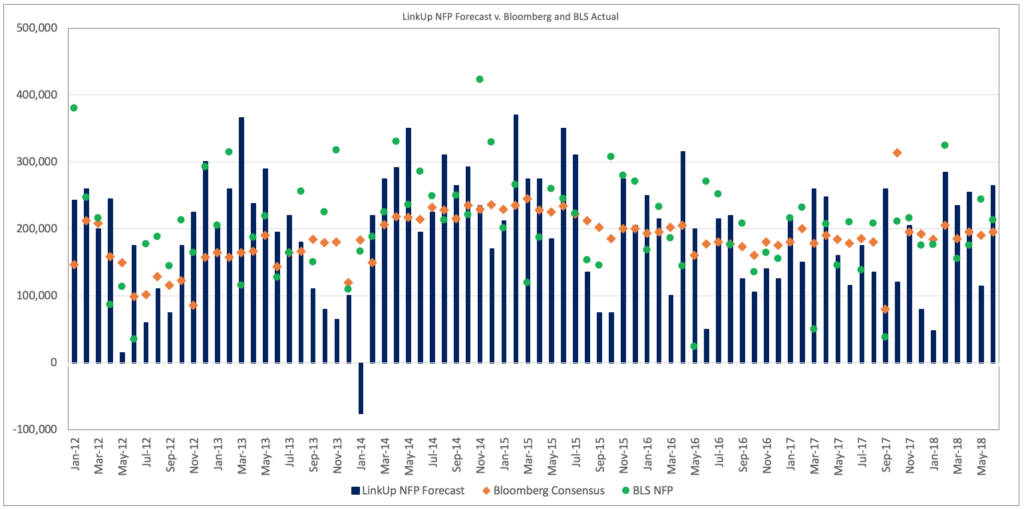
In assessing our performance, we look primarily at whether or not we are able to accurately predict if the BLS’ non-farm payroll numbers are better or worse than consensus estimates as determined by Bloomberg’s monthly survey of economists. Secondarily, we look at the magnitude of the surprise either way and how well we forecasted the extent of the surprise. And lastly, we look at the quality of our commentary and how well it captured how things actually turned out in retrospect across the job market, wages, and other macro indicators.
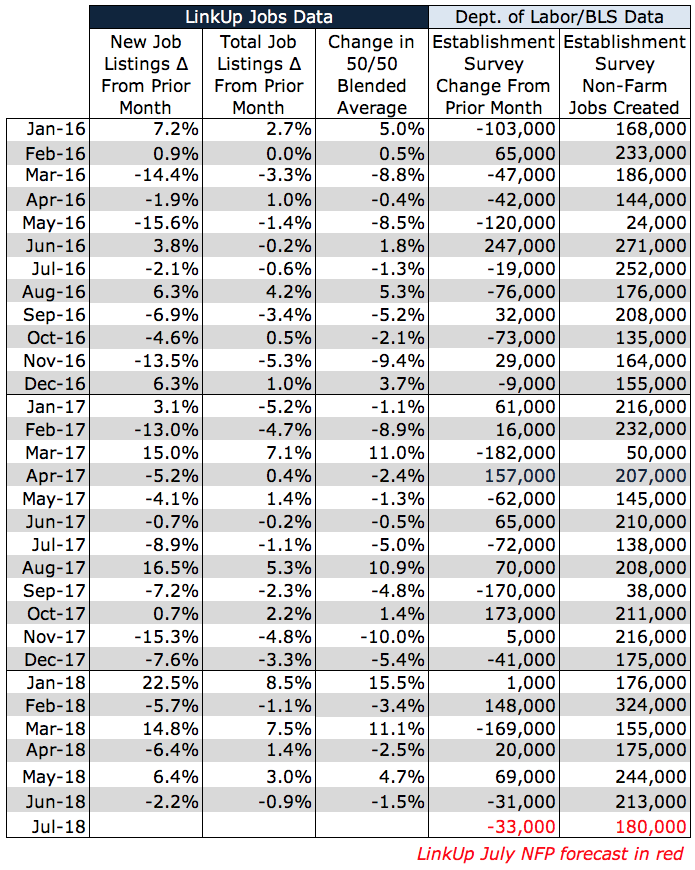
As the table below indicates, we jumped off to a strong start early in the year, hit a bad stretch in the spring, and just made it back to 3-3 through June. Given that our goal is to consistently beat a coin toss over the course of the year, we’d give ourselves a B- for a mid-term grade – not particularly impressive but not a complete disaster either. Final BLS revisions could still swing May and June one way or another, so there’s still an element of ‘Incomplete’ to our self-awarded grade but there’s clearly plenty of room to improve.

In 4 of the past 5 years beginning in 2012, our NFP forecast has been accurate in 7 of 12 months and last year, we made accurate calls in 6 of 11 months after combining September and October into a single period to account for an absurdly anomalous and tragically devastating hurricane season.
Given that extended track-record, we’d give ourselves a 5-year grade of an A- or a GPA of 3.7. But truth be told, the strength of that track-record is driven more by the quality of our job market data than the sophistication of our forecasting model. Because we only index jobs directly from company websites (roughly 5 million jobs updated daily from 50,000 company websites around the world), our job market data is always current and there are no duplicate listings because we only index jobs from a single source – the employer’s website itself. Equally as important, we do NOT aggregate jobs from other job sites, so we have completely eliminated job board pollution from our job market data. As a result, we deliver the most comprehensive, accurate, and predictive job market data in the industry.
So if one were to beat us up on our track-record and our self-awarded grade, I’m not sure I’d argue too strenuously (depending, of course, on the accusers own track-record), standing firmly behind our data and blaming any forecasting flaws on a less-than-perfect forecasting model. We are continuing to work on improving that model and as part of that effort we will be incorporating into the model the LinkUp 10,000.
Earlier this year, we introduced The LinkUp 10,000 – an analytic, published both daily and monthly, that captures the sum total of U.S. job openings from the 10,000 global employers in LinkUp’s job search engine with the most U.S. job openings. Representing the entire U.S. economy, the LinkUp 10,000 is a macro indicator designed to measure real-time changes in U.S. labor demand. And because job openings are highly correlated to job growth in future periods, the predictive attributes of the LinkUp 10,000 deliver valuable insights into the future direction of the U.S. labor market.
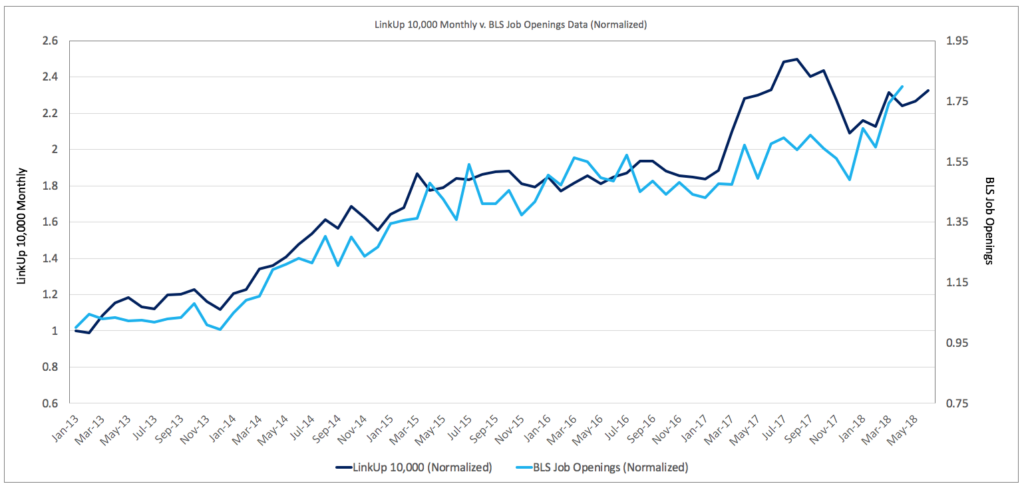
Not surprisingly, The LinkUp 10,000 is highly correlated to and predictive of the number of job openings reported each month in the BLS’ JOLTS data (at least, we think it is correlated to and predictive of BLS job openings data, assuming there aren’t any errors like this one they just announced last month). And of course, JOLTS data is released more than 30 days after the end of the month while The LinkUp 10,000 is released both daily and monthly on essentially a real-time basis.
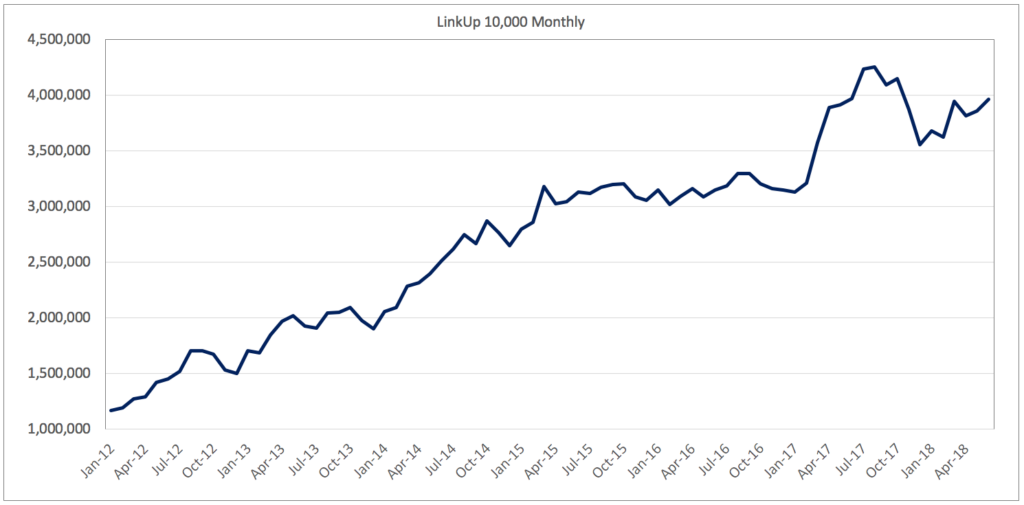
Looking at the raw data, the total number of job openings for the 10,000 employers with the most job openings in LinkUp’s search engine has risen from 3.7 million in January of this year to 4 million.
In addition to incorporating the total job openings data into our forecasting model, we are also integrating data related to the number of new job listings posted in a given month as well as the number of removed job listings (a solid proxy for jobs that were filled with a new hire).
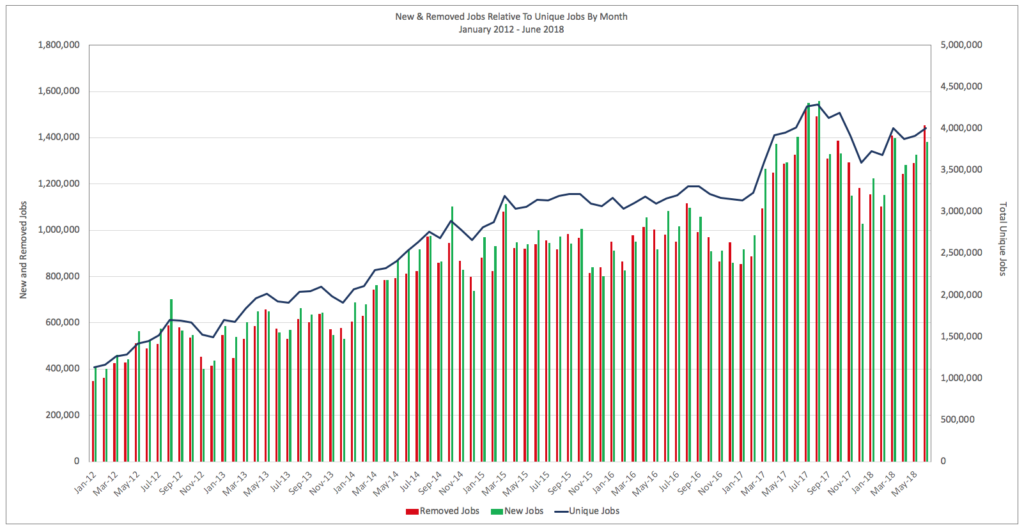
With our job market data, we can also provide highly granular and extremely accurate insights into precisely where in the economy labor demand is expanding and contracting.

And finally, we are improving our forecasting model by fine-tuning how we account for changes in our Job Duration data. Each month, we look at all of the jobs that were removed from our search engine because the employer removed them from their corporate career portal (presumably because the job was filled) and calculate the average number of days that those jobs had been open. This Job Duration metric is a very close proxy to a ‘Time-to-Fill’ metric that hiring managers and HR departments use and essentially measures the velocity of hiring across the entire U.S. economy (and, of course, we can measure Job Duration down to a zip code level as well as by job category, industry, and company).
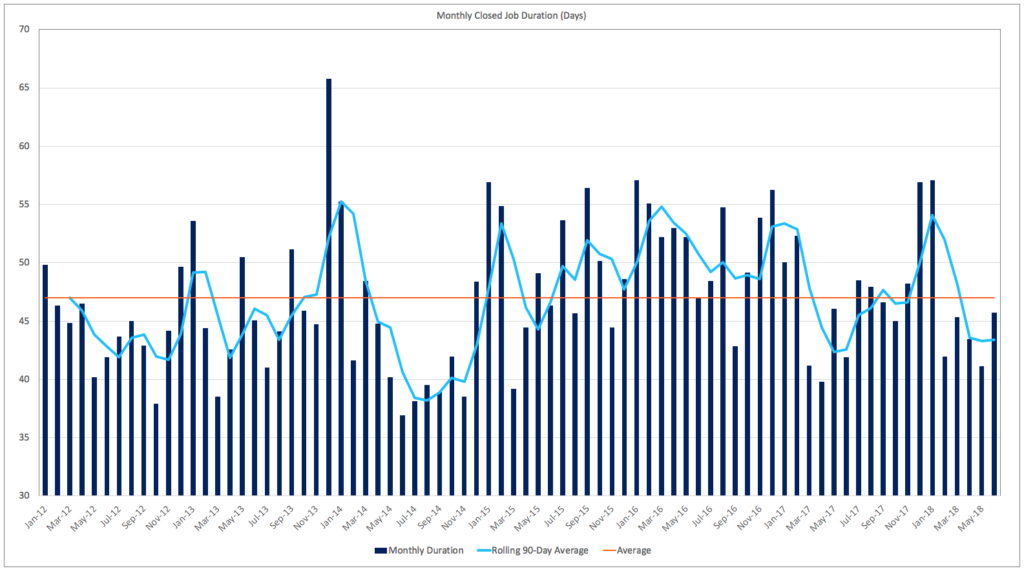
Interestingly, Job Duration can mean different things in different business cycles or at different stages in the same cycle. Looking at the current full employment environment and average annual job duration in the chart below provides a perfect case study of how Job Duration can fluctuate over time despite a consistent, record-setting stretch of 93 consecutive months of monthly job growth.
Job Duration rose starting in 2015 as companies began finding it increasingly difficult to find qualified applicants and, later in the cycle, any applicants at all. But as the labor market extended further and further into record-setting territory, employers became more and more inclined to hire the first halfway decent applicant they could find, thus accelerating their hiring and reducing the time-to-fill or Job Duration.
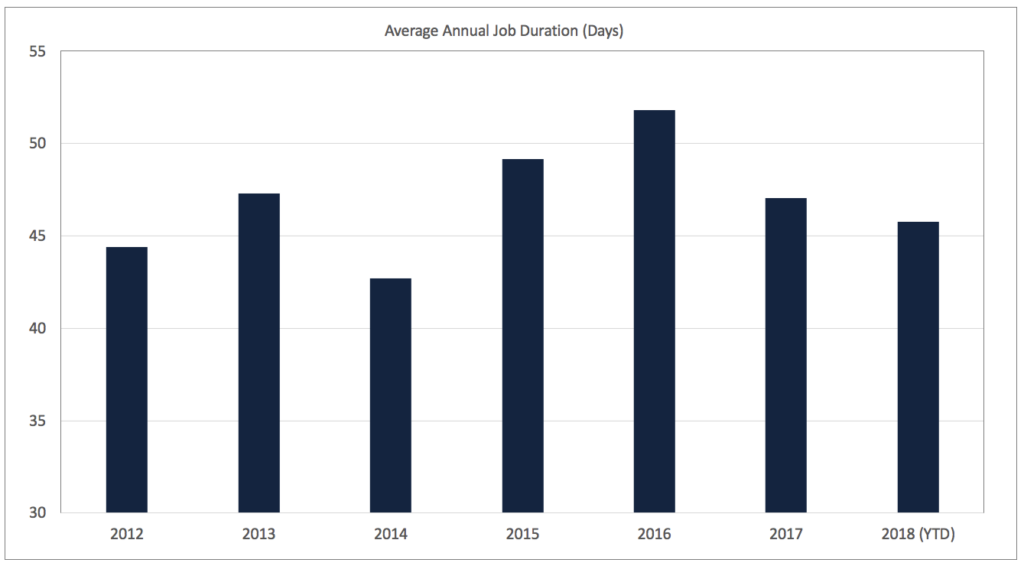
But at some point, every business cycle ends and when it starts to turn, Job Duration will begin rising again as companies become increasingly cautious about hiring. Employers might not pull job openings or unfilled ‘recs’ off their site right away, but they’ll likely be particularly choosy about who they hire, thus extending their time-to-fill and increasing overall Job Duration. As a result, Job Duration is a metric we pay close attention to for signs that things are beginning to turn.
So where are we these days with the labor market? Even prior to the eruption of multiple, simultaneous trade wars with seemingly every nation on earth, it was challenging to look beyond 6 months or so and say with certainty how much longer the current streak of monthly job gains could go. And now, with the chaos caused by Trump’s trade policy and the uncertainty surrounding when and how significantly tariffs will impact hiring, it’s even more difficult.
As a result, we’ll confine our prognostication to July’s jobs report and look at LinkUp’s job market data from June to forecast July’s non-farm payrolls. In June, new and total job listings on LinkUp fell 2% and 1% respectively, with declining job listings in the majority of states across the country.
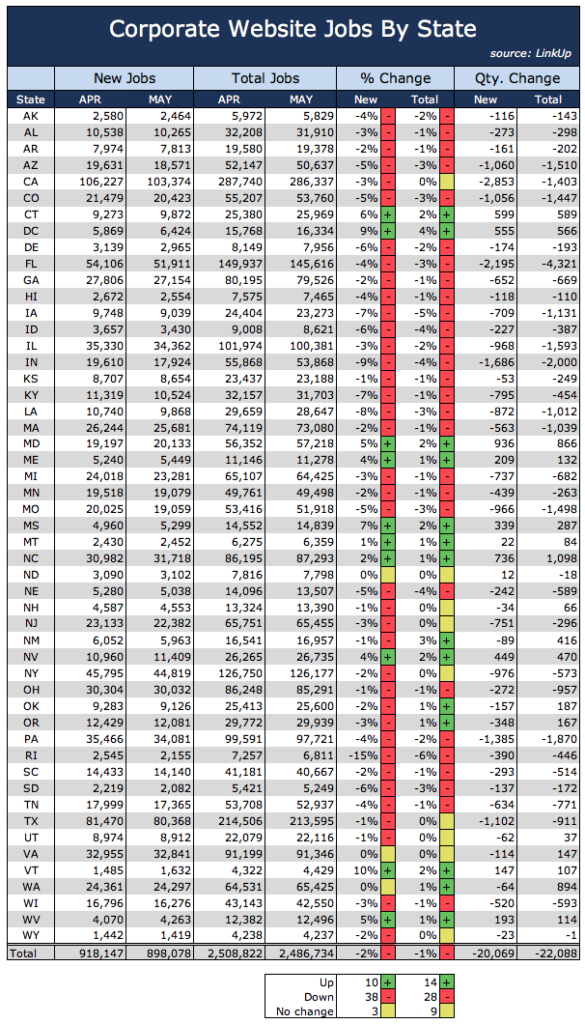
As a result of the decline in job listings in June, we are forecasting a net gain of 180,000 jobs in July, slightly below consensus estimates.
In thinking about the massive uncertainty around how and when (not if, as I am leaving aside until definitively proven otherwise what are likely little more than empty promises from Trump to Juncker) Trump’s trade wars will impact the economy in general and hiring in particular, I was particularly impressed with Neil Irwin’s article last week in the New York Times – If the Trade War Starts to Damage the U.S. Economy, Here’s How You’ll Be Able To Tell.
In the article, Irwin states:
To assess how the trade war could affect growth, the job market and inflation at the macroeconomic level, you need data. The trouble is that much economic data operates with long time lags. By the time there would be solid evidence that the trade war was doing damage, the damage would already have been done.
But certain indicators are likely to provide early signs of trouble: data that is more big picture than individual anecdotes, but more timely than things like G.D.P. and the unemployment rate.
Irwin then lists the following data points as things he’d look to for early signs that the trade war is damaging the economy:
- • The Federal Reserve Bank of Philadelphia’s survey of manufacturers to predict future capital spending
- • The stock market to see if the trade wars’ impact extends beyond the few large, obvious firms
- • Commodity futures markets to gauge future inflation
- • The Institute for Supply Management’s survey to measure business sentiment about hiring
- • Unemployment Claims to see if the depth and breadth of layoffs start to become material
To that excellent list, we’d add The LinkUp 10,000.
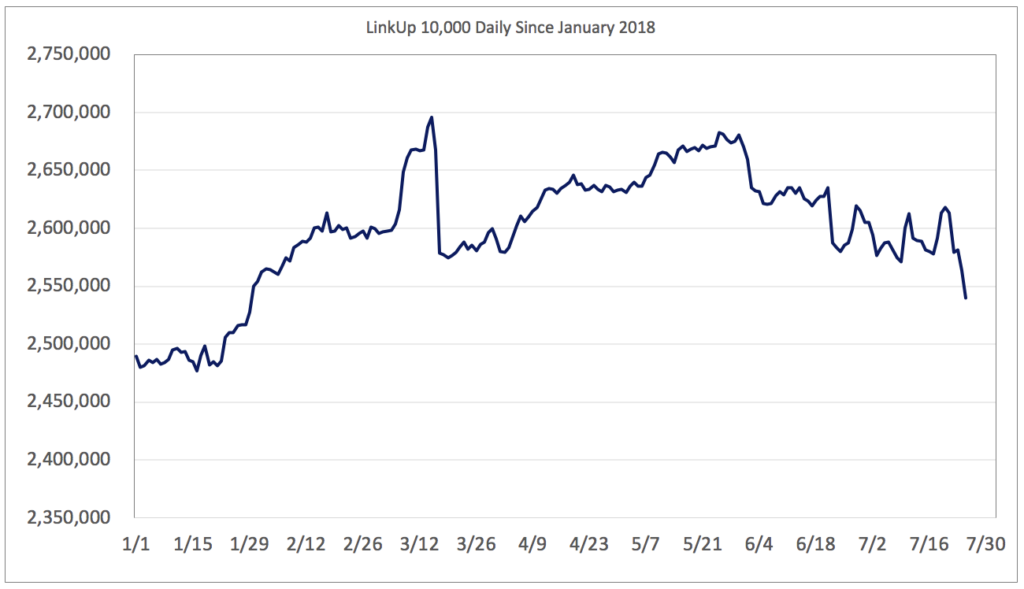
The LinkUp 10,000 Daily has been a bit volatile since the beginning of the year but it’s averaged just under 2.6 million job openings since the 1st of the year. But looking at the average daily jobs by month since January indicates that labor demand has dropped since peaking in May.
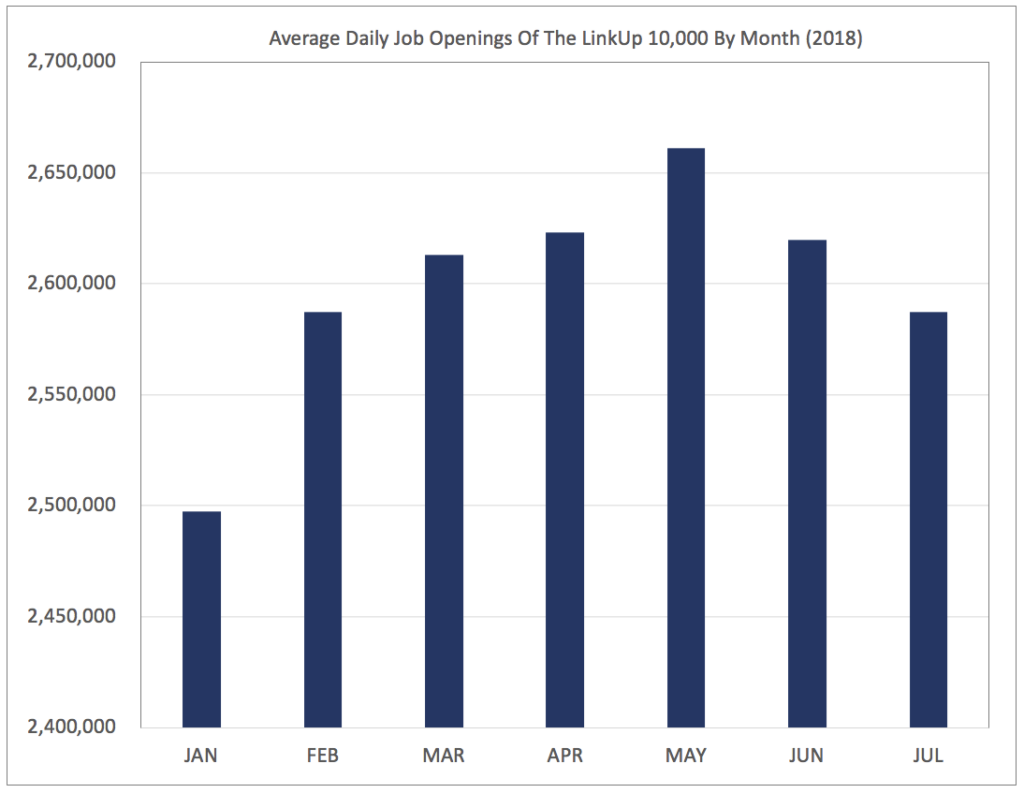
While it’s difficult to assess with certainty whether or not this decline is the result of seasonality, generally weakening labor demand, tariffs, or some combination thereof, there is no doubt that labor demand has dropped over the past 60 days. And if that trend continues while at the same time Trump continues to push us further and further into a full-blown, multi-front, world trade war, the case becomes stronger and stronger that the administration’s misguided trade policy is negatively impacting job growth. And because The LinkUp 10,000 is published daily, it provides essentially real-time visibility into what is happening with labor demand. As Irwin rightly points out, there is no substitute for “data that is more big picture than individual anecdotes, but more timely than things like G.D.P. and the unemployment rate.”
Insights: Related insights and resources
-
Blog
02.02.2017
LinkUp Forecasting Solid Job Gains In January and Continued Strength In February
Read full article -
Blog
09.01.2016
LinkUp Forecasting Net Gain of 220,000 Jobs In August
Read full article -
Blog
03.03.2016
LinkUp Forecasting Decent Job Gains In February
Read full article
Stay Informed: Get monthly job market insights delivered right to your inbox.
Thank you for your message!
The LinkUp team will be in touch shortly.
