LinkUp Forecasting April NFP of 248,000, Well-Above Consensus Estimates
A change to our nonfarm payroll forecasting methodology.

It’s been on my ‘to-do’ list for a few nonfarm payroll forecast blog posts, and for better or worse, I am going to highlight here a change to our NFP forecasting methodology. Not only is it a bit overdue, but it also conveniently gives me an excuse to punt on the blog post I should be writing on the current administration’s likely medium and long-term impact on the labor market which would require more hours than I currently have. So with the abbreviated pre-amble, I’ll jump into the minutiae of our NFP forecasting model and then touch on our NFP forecasts for both April and May.
We developed our initial model about 8 years ago when we started issuing nonfarm payroll forecasts using job listings indexed exclusively from corporate career portals on company websites. At the time, we were indexing approximately 1 million jobs from about 10,000 company websites (we are currently indexing 3.5 million jobs from 30,000 companies). And because we were (and still very much are) continuously adding new companies and job openings, our forecasting methodology had to account for the upward bias inherent in a perpetually expanding job dataset. To accomplish this, we used (and still use) a ‘paired-month’ methodology that compares new and total job growth from one month to the next using only those companies that are common between the two months being compared.
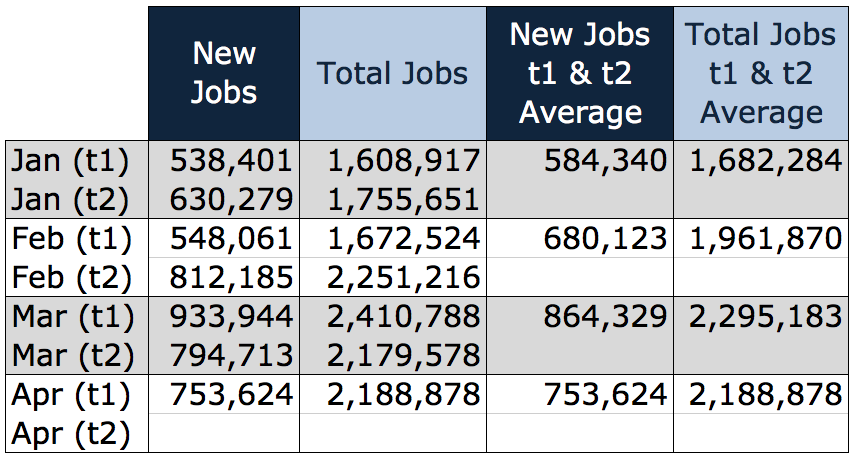
So using 2017 job data for illustrative purposes, each month will end up having 2 data points each for both new and total jobs – the first time (t1) when we compare the current month to the prior month, and a second time (t2) a month later when the next month is compared to its prior month. So focusing on March in the table below, we get March (t1) new and total jobs on April 1st when we compare March to February, and we get March (t2) new and total jobs on May 1st when we compare March to April.

But the 2nd aspect of our methodology that we developed 8 years ago was to create an average of t1 and t2 for both new and total jobs for a given month. We used the average of t1 and t2 for a month for the sole purpose of smoothing out job market data anomalies that resulted from ‘scrapes’ that broke during the process of indexing jobs from applicant tracking systems used by companies to publish their jobs on their company websites. At the time, our scraping and indexing technology was far less sophisticated than it is today, and broken scrapes were frequent enough that they had a sufficiently material impact on the data. We were also a smaller company back in 2009 and had fewer resources dedicated to adding new companies so the pace of growth in the dataset was less than it is today and the ‘washing-out’ impact on the paired-month methodology by averaging t1 and t2 wasn’t that significant.
Over the subsequent 8 years, however, our company has grown considerably and we have made significant investments in the technology, people, tools, and systems around our jobs platform. While broken scrapes will always be an inherent aspect of our job market data, the frequency of breaks has diminished and we have added resources such that we can identify and repair broken scrapes much faster than in the past.
Even more importantly, the significant investments we’ve made in our platform has allowed us to increase the pace of adding new companies and job listings to the dataset, and that rate of growth itself is accelerating. As a result, the use of the average of t1 and t2 for new and total jobs has not only become less necessary, it has actually detracted from the model’s effectiveness in forecasting net job gains in the monthly nonfarm payroll reports. Hence its elimination.
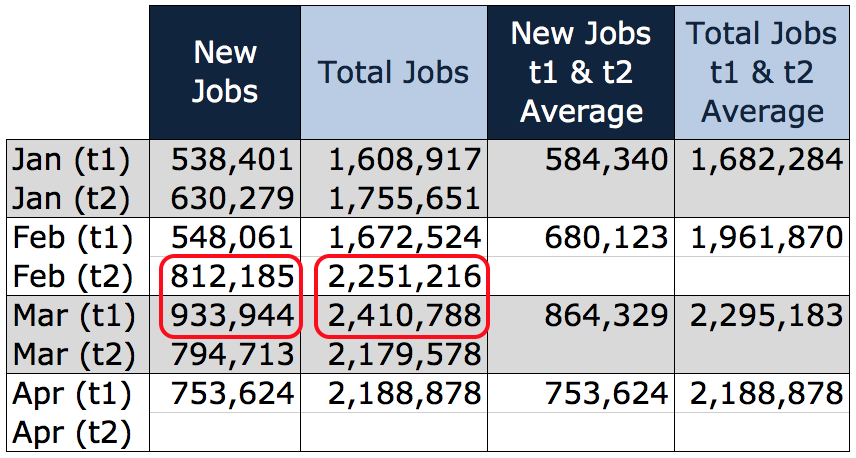
To be clear, we are still using a paired month methodology where we normalize or constrain the dataset to only include or count new and total job gains for a set of companies that were common between the two months being compared. So using the table below, we calculated new and total job gains in March on April 1st using a set of companies that were in the dataset in both February and March, and compared March relative to February. As highlighted in red below, new job gains in March rose by 121,79 or 15%. Total job gains rose by 159,572 or 7%.

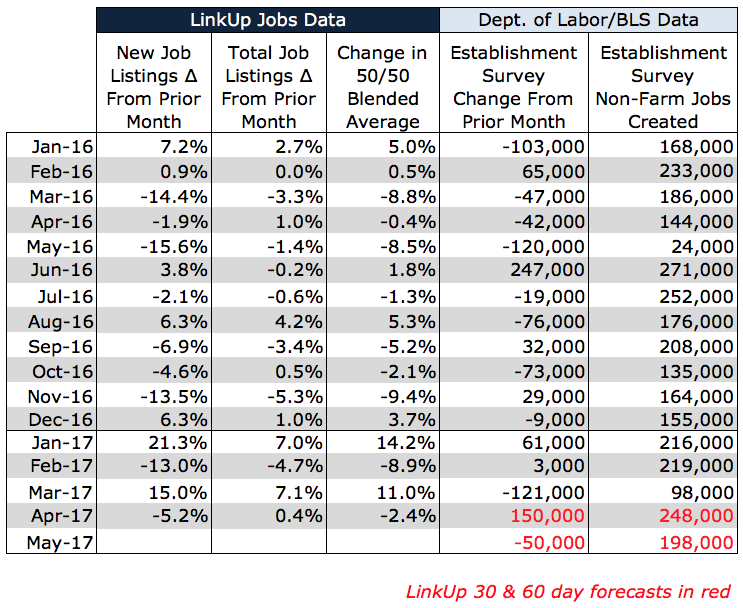
The last step of our methodology averages the new and total job gains or losses in percentage terms which we then translate to net increase or decrease in job gains relative to the prior month’s net job gains. With approximately a 30-day lag between the time a company publishes a job opening on its company career portal and when that position is filled with a new hire, we use the February (t2) and March (t1) data to forecast net job gains in April. So for April’s forecast, the 11% average in new and total job gains in March (relative to February) equate to a forecasted NFP report for April of 248,000.

The other benefit of eliminating the use of the average between t1 and t2 for a given month means that we don’t have to wait 30 days to get the 2nd data points (new and total jobs t2) for each month. As a result, we can now issue a preliminary ’60-day’ NFP forecast each month.
In the case of our data for April, as detailed in the table above, new jobs decreased by 5.2% from March, while total jobs rose by 0.4%. The average percentage change of -2.4% translates to a preliminary forecast for net job gains in May of 198,000 which the Bureau of Labor Statistics won’t announce until June 2nd (so it’s not technically a ’60-day’ forecast but rather a preliminary forecast for the current month).
The key thing to remember, however, is that our forecast for May (in this example a decrease of 50,000 from whatever NFP for April actually turns out to be), is based on the job gains relative to our forecast for April. Actual NFP for April won’t be released until BLS issues April’s Employment Situation Report on Friday (which they then revise on June 2nd and again on July 7th). In the case of our preliminary forecast for May, you can also wait until BLS issues its data for April and then subtract 50,000 to get our updated forecast for May.
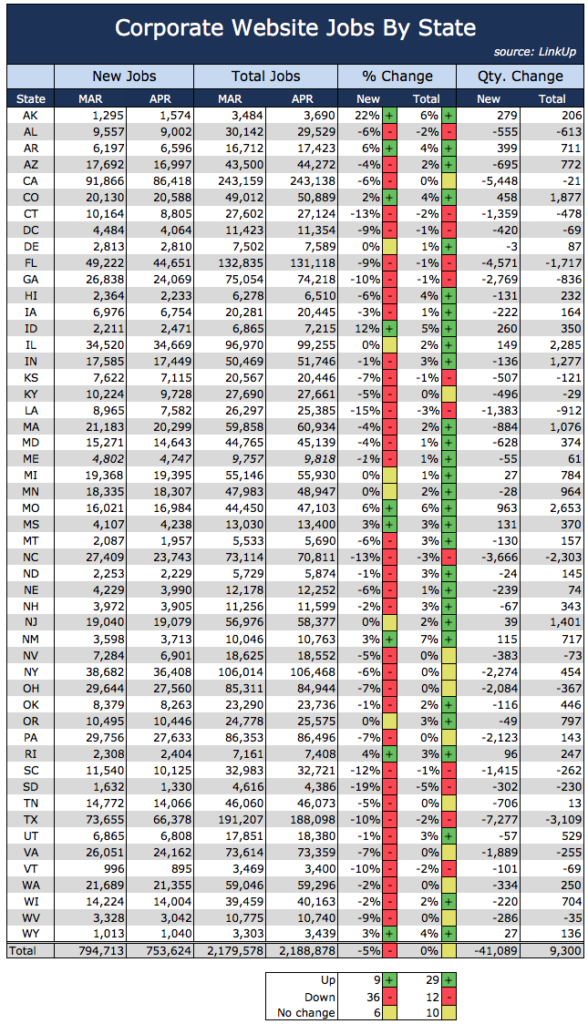
So regardless of whether or not the explanation around how, why, or when we can now issues our preliminary forecast for May’s NFP, the data clearly shows that labor demand slowed to some extent in April – new job listings decreased 5% with decreases in 36 states, while total job gains stayed flat relative to March. Although 29 states showed gains in total jobs, total job gains for the country as a whole were up only 0.4%.

So putting it all together, we are forecasting job gains of 248,000 in April, a forecast well above consensus estimates. And for May, we are forecasting slightly less robust job gains of 198,000 – still a solid month of job gains but slightly lower than April. Broadly speaking, we see continued strength in the labor market through Q2 which should result in increased labor force participation rates and further gains in wages across the U.S. economy.
Insights: Related insights and resources
-
Blog
12.03.2020
LinkUp Forecasting Non-Farm Payroll Gain of 490,000 Jobs in November
Read full article -
Blog
06.29.2018
Strong Job Growth In June Should Make For Some Great Fireworks Next Week
Read full article -
Blog
10.26.2017
The New Abnormal Is Wreaking Havoc on Job Market Forecasts; LinkUp Predicting Net Gain of 120,000 Jobs In October
Read full article -
Blog
08.31.2017
LinkUp Forecasting Net Gain of Just 135,000 Jobs For August's NFP Report
Read full article -
Blog
05.30.2017
LinkUp Forecasting NFP of 160,000 Jobs For May
Read full article -
Blog
03.03.2016
LinkUp Forecasting Decent Job Gains In February
Read full article
Stay Informed: Get monthly job market insights delivered right to your inbox.
Thank you for your message!
The LinkUp team will be in touch shortly.
