Jobs 101: What is the job market?
Read the LinkUp blog for a deeper look at the complex dynamics of the job market—and why we need to shift our understanding of the modern job market.

The job market is a concept so ubiquitous that its fundamentals often go unexamined. Always a bellwether of economic health, job market metrics have become even more salient in the last several years—most notably because of how the dynamics of the job market (and the broader economy) have increasingly defied conventional paradigms and confounded experts, analysts, business leaders and policy makers.

The importance of the job market merits a deeper look at how we define and understand it: the metrics, terms, and concepts that shape our conventional understanding of how the job market functions, the key macro trends adding dynamic complexity to the job market today, and how traditional metrics are (and are not) capturing this modern complexity.
What is the job market?
The job market describes the buying and selling of labor. Like any marketplace, the job market centers on key concepts:
- Supply: Workers and people seeking work.
- Demand: Employers and people seeking labor.
- Equilibrium: The natural balance point between supply and demand.
- Price mechanism: Wages provide the mechanism driving the job market toward equilibrium.
How do we define and measure the job market?
The traditional metrics used to understand the U.S. job market come from the Bureau of Labor Statistics (BLS), part of the U.S. Department of Labor. No single metric can begin to capture the complexity of the dynamic jobs market, but in general, the following are the most prominent measures of labor market activity:

The Big 5: Traditional Job Market Metrics
Unemployment rate
The unemployment rate measures the percentage of the total labor force (defined as those actively employed or actively seeking work) who are currently unable to find jobs. Unemployment is the hallmark job market metric used to understand and predict economic health. High unemployment typically portends a contracting or slowing economy, signaling that employers are reducing their workforce and/or slowing hiring to address declining revenue and growth. Low unemployment is generally understood as a signal of a strong and growing economy, where employers are hiring and wages are often rising.
Nonfarm payrolls
Nonfarm payrolls (also referred to as nonfarm employment or total nonfarm payrolls) are traditionally used to define the size of the U.S. labor force. Nonfarm payroll measures the total number of people employed in the United States—excluding the following types of workers:
- Farm workers
- Private household employees and domestic household workers
- Self-employed workers and sole proprietors operating without registered business incorporation
- Non-profit employees
- Active military service members
- Government-appointed officials
- Employees of the Central Intelligence Agency, National Security Agency, the National Imagery and Mapping Agency, and the Defense Intelligence Agency
As the name suggests, this metric historically excluded farm and domestic workers to eliminate the messiness presented by seasonal and part-time labor, unpaid family labor, and the majority of farmers being self-employed or sole proprietors.
Labor force participation rate
The labor force participation rate represents the percentage of the working-age population (typically individuals aged 16 and older) who are either employed or actively seeking employment and available to work. This metric helps gauge the proportion of people who are actively engaged in the job market.
High participation traditionally signals a strong labor market and correlates with economic growth. Lower participation can be influenced by discouraged workers who have given up on actively searching for jobs, and is often thought of as a lagging indicator of economic slowing.
However, low participation may also represent individuals seeking to expand skillsets through full-time education, workers opting for early retirement, or other factors that temporarily or permanently remove them from the supply side of the job market. For example, through the last several years, fears around the health risks of COVID-19 led many workers to sit on the sidelines of the job market. Others were forced out of the job market to care for children, elderly parents, or to address their own health needs.
Employment rate/Employment-to-population ratio
Related to labor force participation, the employment rate refers to the percentage of the working-age population (typically age 16+) that is currently employed. The employment rate indicates the utilization of supply (workers) in the job market. Like labor force participation, a high employment rate is generally understood as a positive economic indicator. The employment rate is also frequently used to compare employment levels at a demographic level—by gender, age group, location, etc.—to understand trends and challenges in the job market.
JOLTS
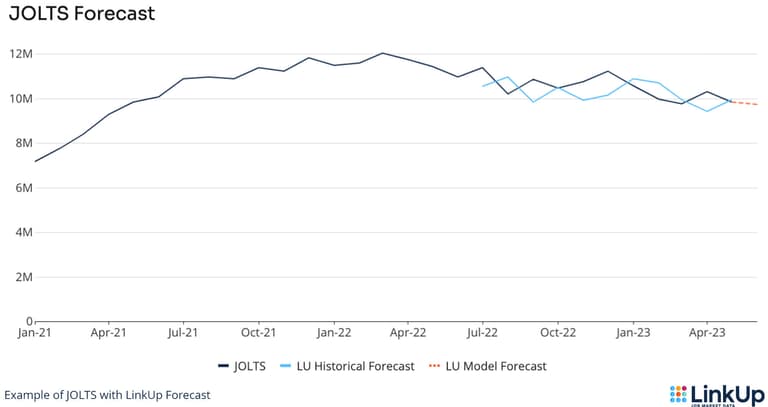
The Job Openings and Labor Turnover Survey (JOLTS), conducted by the BLS, is not a single metric, but rather a monthly report that includes the following:
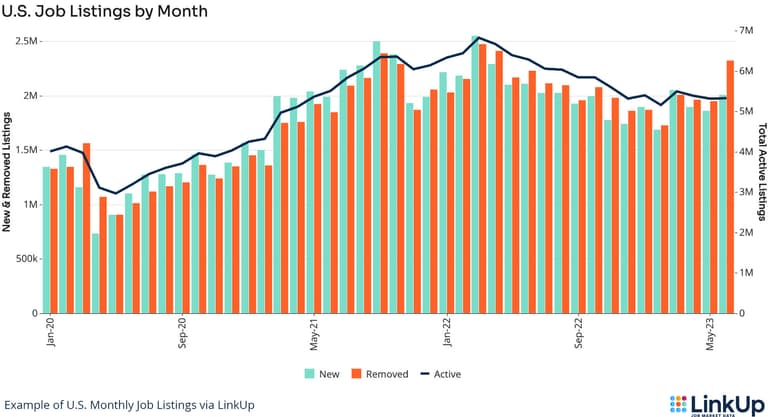
- Job Openings: The total number of job openings posted during a specific month. Job openings are typically used as the key indicator of labor demand in the job market.
Hires: The number of hires made by employers during the surveyed month. Hires reflect the pace of job creation and signal that companies are seeing or anticipating growth and expanding their workforce.
Total Separations: The total number of workers who left their jobs, either voluntarily (through quits) or involuntarily (through layoffs or discharges), during the surveyed month. This is a key measure of turnover in the labor market.
Quits: A subset of separations, quits are workers who voluntarily left their jobs during the surveyed month. The quits rate is often used as an indicator of workers' confidence and leverage in the job market.
Layoffs and Discharges: The other component of separations—the number of workers who were laid off or discharged (fired) by their employers during the surveyed month. This metric can gauge overall business conditions.

Other job market metrics to know
Average hourly earnings/Wage growth
Average earnings measure the “going rate” for labor in this economy, i.e. the average wage earned by workers across the U.S. job market. Earnings are an important indicator of worker well-being. Wage trends also present insight on how the essential price mechanism is functioning in the job market: In classic theory, low unemployment, a high employment ratio and more job openings should correlate with rising wages, and wage growth should slow as openings decline and unemployment ticks up. Rising wages are conventionally considered a lagging indicator of inflation.
Employment Cost Index (ECI)
Wages are just one part of the total cost of labor for employers. The ECI is a quarterly economic indicator that measures the total or true cost of labor for businesses, including wages along with the cost of providing benefits such as health insurance, retirement plans, and paid leave. Understanding how the total cost of labor is changing over time (and predicting that change) is critical for businesses as they consider growth and labor strategies, as well as for analysts and policymakers as they seek to understand overall inflation and other economic pressures faced by employers.
Labor productivity
At the other end of the equation from labor costs is labor productivity. Labor productivity measures the output produced per unit of labor input (measured either as number of employees or number of hours worked). It’s used as an indicator of the efficiency and competitiveness of the job market, as well as a broader economic indicator: Rising productivity is typically correlated with higher business revenue and economic growth, generally (but not always) pushing up wages.
Underemployment
A vital but often overlooked metric that’s related to labor productivity, underemployment measures the percentage of workers who are currently employed but would like to work more hours, or are working in jobs that do not fully utilize their skills and qualifications. Underemployment provides critical insight into the relative matching between worker preferences and skillsets and the available job opportunities. In other words, it’s a vital metric for understanding how efficaciously the job market is functioning. An underemployed workforce represents an underutilized supply, indicating less-than-optimal outcomes for both workers and businesses.
Initial jobless claims
A subset of overall unemployment, initial jobless claims (also known as new unemployment or jobless claims) is measured weekly and covers the number of individuals who have filed for unemployment benefits for the first time. The weekly nature of the metric gives more rapid insight into the changes in the job market and overall economy.
Continuing jobless claims
Another subset of overall unemployment, continuing jobless claims (also known as continuing unemployment claims or continuing claims) measures the number of individuals who have filed for consecutive unemployment benefits and have yet to find a job. Some level of unemployment is natural, and this weekly metric gives insight into how quickly and easily the available labor supply can find new job opportunities. High or rising continuing claims can also be a leading indicator of declining labor force participation, as frustrated or discouraged workers eventually stop actively searching for jobs.
What is job market tightness?
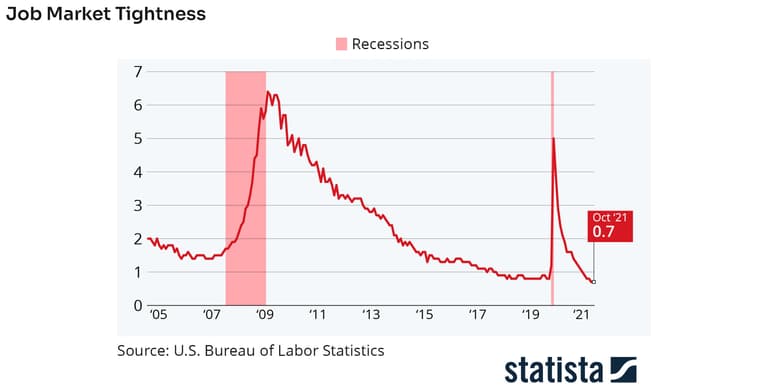
While all of the metrics outlined above are prominently used in discussions of the job market, at the most general and colloquial level, the job market is often defined or talked about in terms of tightness. The relative tightness of the job market is derived from several of the traditional metrics outlined above, as well as:
- Job Vacancy Ratio or Job Vacancy Rate: This metric compares the size of the total employed workforce (nonfarm payrolls) to the number of current job openings.
- Vacancy-to-Unemployment Ratio or V/U Ratio: This ratio compares the number of current job openings (vacancies) to the number of people seeking employment (the unemployment rate). A higher V/U ratio correlates with a tighter labor market.

Why tightness fails to tell the full story of the job market
The concept of tightness offers a simple way to think about the relative supply and demand in the job market. Tightness also serves as a proxy for economic health. A tighter labor market is typically associated with strong economic growth, as confident and capital-rich businesses are increasing their workforces to support and drive further growth.
Yet the concept of tightness increasingly fails to account for the many complex dynamics of the modern job market. The rigid, one-dimensional concept of tightness views all job openings equally and takes a similarly homogenous view of available labor supply. In reality, both supply and demand are very nuanced and heterogeneous.
Jobs 101 – Part 2: The key trends shaping the job market today
Numerous external factors and broader trends can shape the relationship between the available supply and demand of the job market. Thus, the experience of individual employers and workers—or entire regions or sectors of the economy—may not correlate with the apparent “tightness” or “looseness” of the labor market at any given time.
The second part of LinkUp’s Jobs 101 series explores these various major trends and external factors impacting the job market, and will examine how traditional job market metrics fail to capture these complex and nuanced impacts.
Insights: Related insights and resources
-
Blog
08.03.2023
Jobs 101 (Part Two): 7 Key job market trends
Read full article -
Blog
08.17.2023
Jobs 101 (Part Three): How the job market functions
Read full article -
Blog
11.06.2023
Gaslit by Bad Data? LinkUp is here to help.
Read full article
Stay Informed: Get monthly job market insights delivered right to your inbox.
Thank you for your message!
The LinkUp team will be in touch shortly.
