January 2023 Jobs Recap: Labor demand grows in first month of 2023
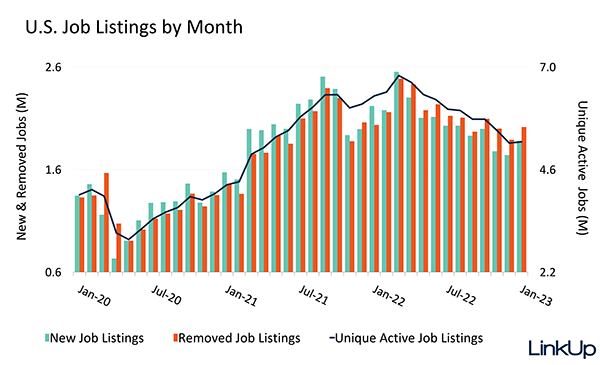
Active U.S. job listings increased a slight 0.6% month-over-month. According to LinkUp job listing data, collected daily and directly from company websites, this is the first overall increase seen since listings peaked in March 2022.


Despite more than 100,000 reported job cuts that occurred throughout January – the largest since 2020 – LinkUp job market data is showing promising growth.
Active U.S. job listings increased a slight 0.6% month-over-month. According to LinkUp job listing data, collected daily and directly from company websites, this is the first overall increase seen since listings peaked in March 2022. Despite more than 100,000 reported job cuts that occurred throughout January – the largest since 2020 – our job market data is showing promising growth.
New job listings increased by 8.0% through January – a stark comparison to December’s 3.2% decline – and removed listings increased by 6.5% compared to just 3.5% the month prior.
Closed Duration
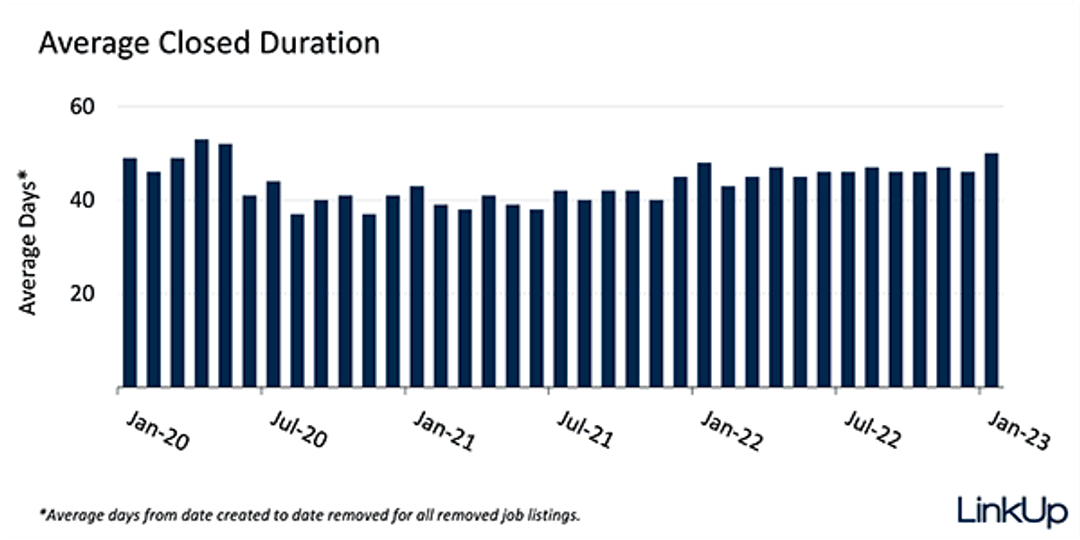
Closed duration, or the average number of days job listings are posted on company websites before they are removed, tracks hiring velocity across the entire U.S. economy. As the average number of days a job listing remains live increases, hiring velocity slows.
Listings removed in January remained open for an average of 50 days – 8.7% longer than the 46-day average of listings removed in December 2022. This leap follows months of little change in the closed duration of listings.
This rise in closed duration appears to align with changes seen across similar time frames in the past. From December 2021 to January 2022, closed duration increased 6.7%. Two years prior, December 2020 to January 2021, the increase in closed duration was 4.9%.
Jobs Data by State
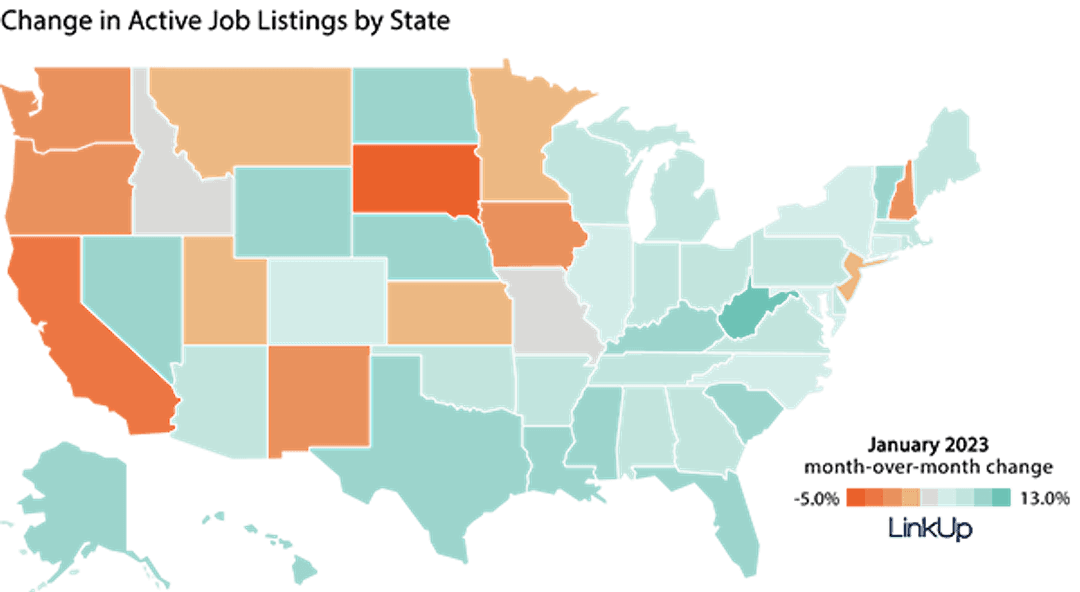
After months of declining job listings across a majority of states, 71% of all states experienced growing job demand from December to January.
States that experienced the most growth in job listings include West Virginia (13.3%), Kentucky (6.1%), Mississippi (5.1%), and Nebraska (5.1%). Of the 29% that experienced job listing slumps, South Dakota (-4.7%), District of Columbia (-4.3%), California (-3.4%), and Oregon (-2.6%) saw the largest declines.
Jobs Data by Industry (NAICS)
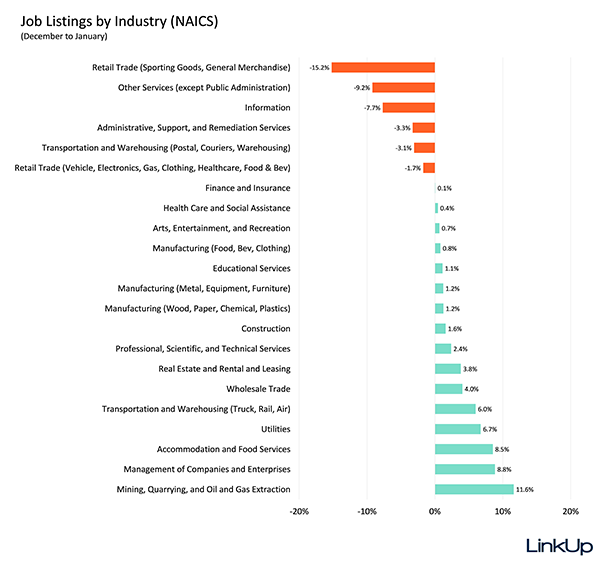
Nearly three quarters of all industries saw job listings increase, with Public Administration (15.7%), Mining, Quarrying, and Oil and Gas Extraction (11.6%), and Management of Companies and Enterprises (8.8%) taking the lead.
Of the industries that saw declines in labor demand, Retail Trade (Sporting Goods, General Merchandise) (-15.2%), Other Services (except Public Administration) (-9.2%), and Information (-7.7%) saw the largest decreases.
Jobs Data by Occupation (O*NET)
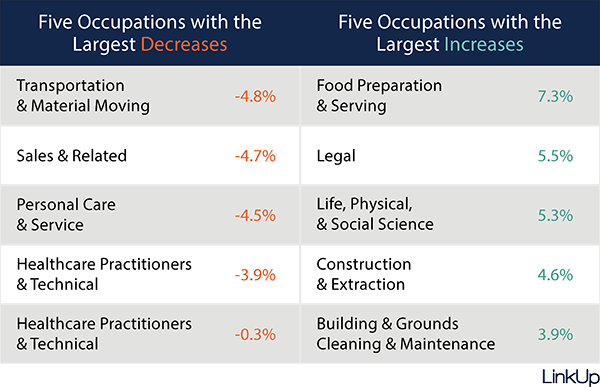
Similarly to industry trends, 71% of occupations experienced growing job demand through January.
Among the categories that saw the largest increases in job listings are Food Preparation and Serving (7.3%), Legal (5.5%), and Life, Physical, and Social Science occupations (5.3%).
Transportation and Material Moving (-4.8%), Sales and Related (-4.7%), and Personal Care and Service (-4.5%), and Protective Service occupations (-3.9%) experienced the largest declines in job listings.
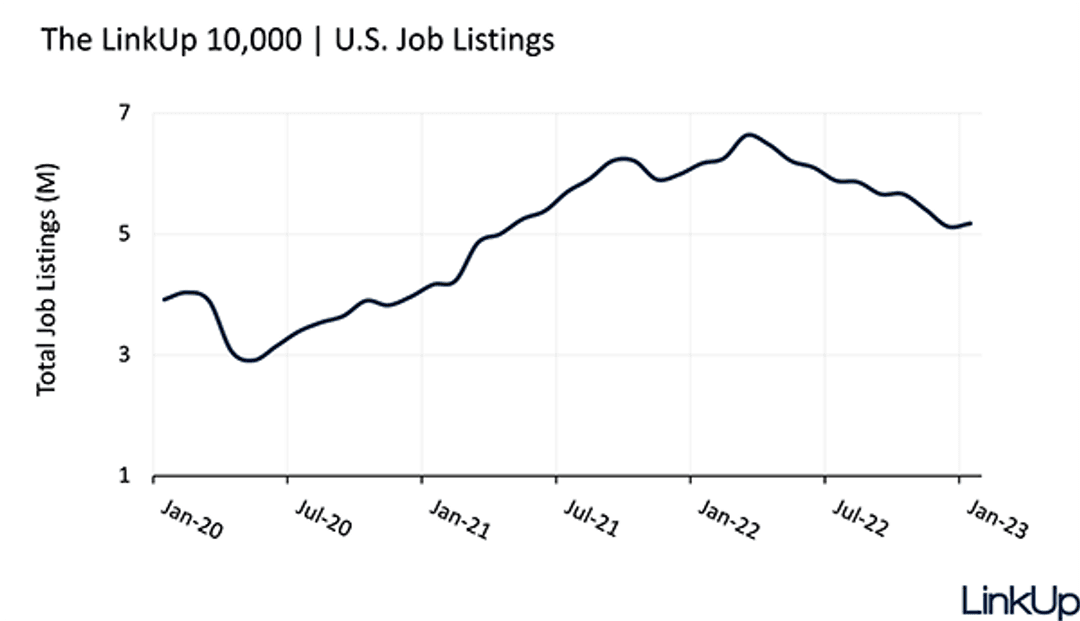
LinkUp 10,000
The LinkUp 10,000 is an analytic published daily and monthly that captures the total U.S. job openings from 10,000 global employers in LinkUp’s jobs dataset with the most U.S. job openings.
While the LinkUp 10,000 jumped by just 1.0% through January, this is the first increase seen since March 2022. This rise follows declines of 5.2% in December and 4.5% in November.
S&P 500 LinkUp Jobs Index
The S&P 500 LinkUp Jobs Index is designed to measure open jobs posted by the companies in the S&P 500 and is published on the S&P website. It can be viewed in aggregate or by sector.
According to the S&P 500 LinkUp Jobs Index, listings were down 2.4% month-over-month overall and showing declines across all sectors except Utilities, which experienced an increase of 5.4%.
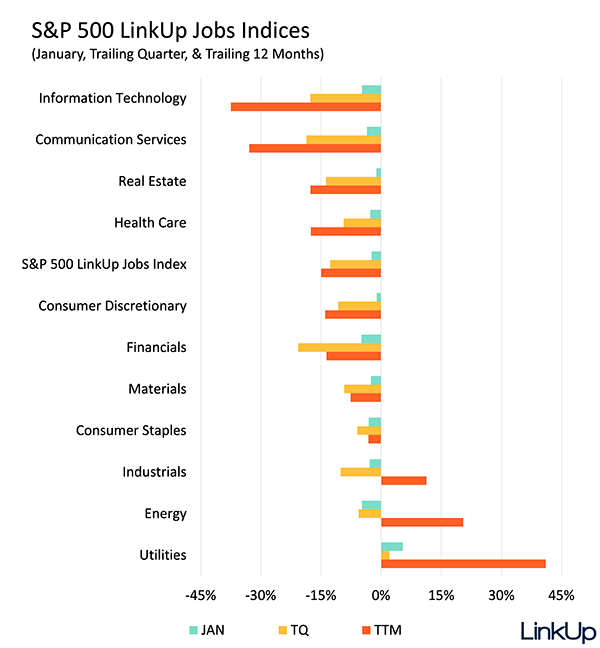
Plummeting labor demand in the Financial sector observed in December (-24.3%) has slowed to a mere -4.9% through January. However, Financials still takes the lead in job listing slumps, followed by the Energy (-4.8%) and Information (-4.8%) sectors.
Methodology Update
Previously, LinkUp has filtered the data in this report to exclude particular companies every month. We are no longer taking that approach and are now reporting monthly job listing data without filtering any specific companies out.
LinkUp 2022 Q4 Economic Indicator Report
In LinkUp’s 2022 Q4 Economic Indicator Report, we take a look at quarterly labor demand changes at the macro, industry, occupation, and state level. Download the free report to read about labor market changes across the last year.
LinkUp Job Market Data Performance Paper
Learn how job market data can be used in investment strategies. Download our LinkUp Job Market Data Performance Report to view four strategies using our data that generate returns.
Insights: Related insights and resources
-
Blog
12.15.2022
November 2022 Jobs Recap: November job listings show cooling labor demand
Read full article -
Blog
09.14.2022
August 2022 Jobs Recap: Jobs are down 3.5% in August, while duration increases
Read full article -
Blog
06.16.2022
May 2022 Jobs Recap: May job listings down 4.2%
Read full article -
Blog
04.22.2022
March 2022 Jobs Recap: Active job listings grew by 3.7%
Read full article -
Blog
01.14.2022
December 2021 Jobs Recap and 2021 Year in Review: A year of growth and changes
Read full article -
Blog
11.12.2021
October 2021 Jobs Recap: Autumn brings falling job listings
Read full article
Stay Informed: Get monthly job market insights delivered right to your inbox.
Thank you for your message!
The LinkUp team will be in touch shortly.
