Insights from our Quarterly Economic Indicators Report: Q3 2021
As we look back on the third quarter of 2021 we see a labor market still clearly showing stress due to the lingering effects of the pandemic.

In the most recent edition of our Economic Indicators Report, we do see the continued positive job listing growth, but in a year marred by rising COVID cases, a broken supply chain and the Great Resignation, it’s difficult to sort out just what that growth might mean.

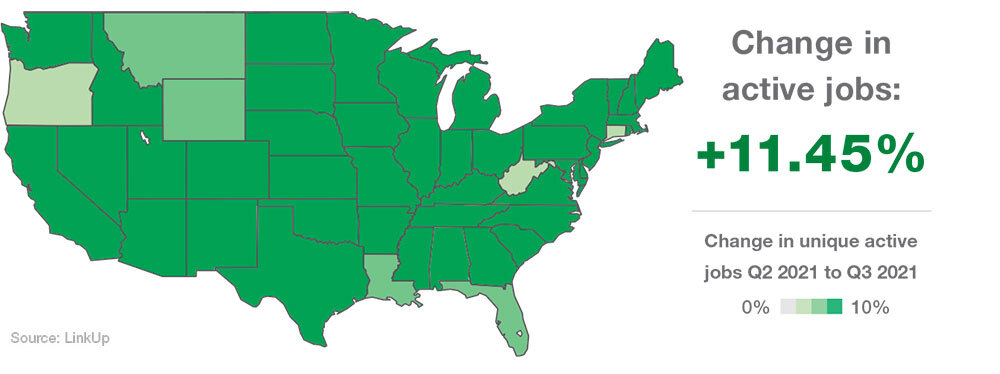
To begin, active job listings were up 11.45%, adding yet another quarter to a long stretch of positive growth. Examining growth by state, we observed that 76% of states saw job listings grow over 10%.

Tennessee topped the list for job growth with a 19% increase in active job listings, while West Virginia, at the bottom of the list, still experienced 3% growth. When we turn to growth by Metropolitan Statistical Area (MSA), we find slightly less positive news. 54% of MSAs decreased their job market diversification over the quarter.
Volatility plateaued following a consistent rise earlier in the year. Job demand increased over the quarter–a nod to employers’ ongoing struggle to fill jobs, rather than the economic growth such an increase typically signifies.
Further evidencing employers’ struggle to hire, job demand increased in almost all occupations in Q3. In fact, in the month of August alone, nearly 7% of employees in the Accommodations and Food Services Sector left their jobs. That is one in every 14 hotel clerks, restaurant servers and barbacks to say “I quit” in a single month. Some restaurants are turning to unconventional methods to make things work when talent is hard to come by. Other occupations with the major growth in job listings in Q3 include Healthcare Support (up 19.7%) and Computer and Mathematical (up 18.6%). See the full report for a breakdown of more occupations.
While there is certainly more analysis to be drawn from the most recent quarter’s report, perhaps it’s best to see the data for yourself. Download our full report to see all the Q3 2021 job market data—job counts, quarter-over-quarter change, occupational and job market diversification changes, and additional maps. And if you’d like to know more about the job data behind the report, please contact us.
↘ Subscribe to receive new job reports directly in your inbox!
Insights: Related insights and resources
-
Blog
04.25.2022
Released: Q1 2022 Economic Indicators Report
Read full article -
Blog
02.03.2022
Insights from our Q4 2021 Economic Indicators Report
Read full article -
Blog
08.05.2021
Just released: Economic Indicator Report Q2 2021
Read full article -
Blog
01.26.2021
Just released: Insights from our Q4 2020 Economic Indicators Report
Read full article -
Blog
11.19.2020
Insights from our new Economic Indicators Report: Q3 2020
Read full article
Stay Informed: Get monthly job market insights delivered right to your inbox.
Thank you for your message!
The LinkUp team will be in touch shortly.
