Accelerating Hiring Velocity Means We Cannot Publish Our October NFP Forecast Until 10AM On Thursday, November 1st
It was 8 years ago this month that began the longest streak of consecutive months in which the U.S. economy reported a net gain in jobs.

It was 8 years ago this month that began the longest streak of consecutive months in which the U.S. economy reported a net gain in jobs. But within that stretch of 96 months, there were dozens and dozens of sub-stories including, among so many others, the slow and painful recovery from the Great Recession, the 1% and Occupy Wall Street, the never-ending sagas and persistent political drama in Washington, budget showdowns, Lucifer in the Flesh, rising income inequality, new Fed Chairs, an invisible recession in 2015/2016, green shoots, the rise of the gig economy, dot plots, and even a bout of The Chaos Syndrome. Oh, and the 2016 election. And through it all, this blog was filled with countless analogies, Game of Thrones references, movie quotes, song lyrics, some observations about the job market, and even occasionally an accurate non-farm payroll forecast.
For certain, two of the larger story lines concerning the labor market over the past 8 years center around the Jobless Recovery and what I’d call the Inflationless Boom, both of which have had an enormous impact on Fed policy and interest rates. While open for debate, the Jobless Recovery ran from roughly 2009 to 2014, at which point the economy had finally added the equivalent number of jobs that had been lost in the Great Recession. In 2014, the economy added a peak of 3.1 million jobs, followed by 2.6 million in 2015.
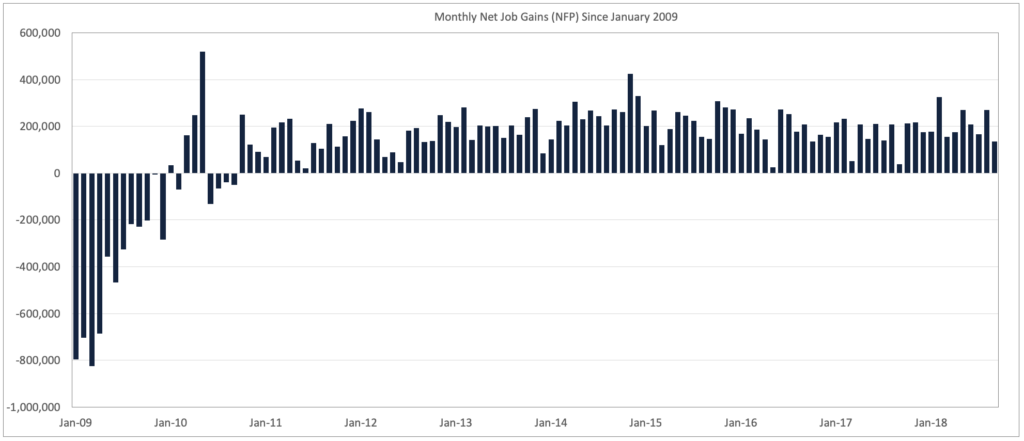
In January of 2016, unemployment finally fell below 5% and we argued that spring that the U.S. economy had finally reached Full Employment. While we may have jumped the gun a bit and still, to this day, maintain an undying faith in the the Phillips Curve, we have not been alone over the past few years in being completely baffled by stubbornly anemic wage gains. During this ‘Inflationless Boom,’ unemployment fell from 4.9% in January 2016 to 3.7% today as the economy added another 6 million jobs. And yet during that period, inflation barely budged at all. Finally climbing above 2% in March of this year, inflation stands today at just 2.2% – only a hair above the Fed’s target rate of 2%.
This persistent lack of ‘official’ inflation, particularly in the form of wage inflation, stands as one of the biggest economic conundrums of the era and serves, therefore, as the basis for enormous debate, particularly within the Fed in regard to the timing and frequency of rate hikes. That debate, or at least one side of it, was perfectly exemplified last Thursday in Neel Kashkari’s op-ed in the Wall Street Journal in which he argued that the Fed should honor its 2016 clarification of the 2% target as being ‘symmetric’ and pause rate hikes to properly assess how much slack remains in the labor market. Others have similarly pushed back on the Fed’s current rate hike trajectory for any number of reasons such as the need to allow wages to rise, to not inadvertently put the economy in reverse, to raise the employment participation rate, to help close the income gap, or because the risks associated with overshooting a 2% inflation target (which might be too low a target in any event) are far smaller than short-circuiting the economy.
While we tend to be of the mind that a healthy dose of wage inflation would be most welcomed for all kinds of reasons, we also recognize that our long suit remains providing accurate, insightful, and predictive data about about labor demand rather than advising the Federal Open Market Committee. As such, I’ll circle back to a few charts highlighting LinkUp data covering the past 4 years – the Post-Jobless Recovery period mentioned above.
It’s also worth noting, briefly and for background purposes, that LinkUp is a job search engine with a very unique approach to both online jobs and job market data in that we only index jobs directly from company websites. Every day, we index 5 million jobs directly from the corporate career portals of over 50,000 company websites. As a result, jobs in our dataset and in our search engine are always current with no expired job listings. And because we only index jobs from a single source, there are no duplicate listings which is a massive problem with every other job site and jobs dataset. And lastly, we do NOT aggregate jobs from other job sites, so we have completely eliminated what we call Job Board Pollution (scams, fraud, lead-gen, phishing, resume gathering, etc.). As a result, we have the largest, highest-quality dataset of global job listings which we leverage in our job market data and candidate sourcing businesses.
So anyway, not surprisingly, the number of daily job openings in LinkUp’s job search engine grew over 3x between 2014 and today, climbing from 1.5 million to 5 million.

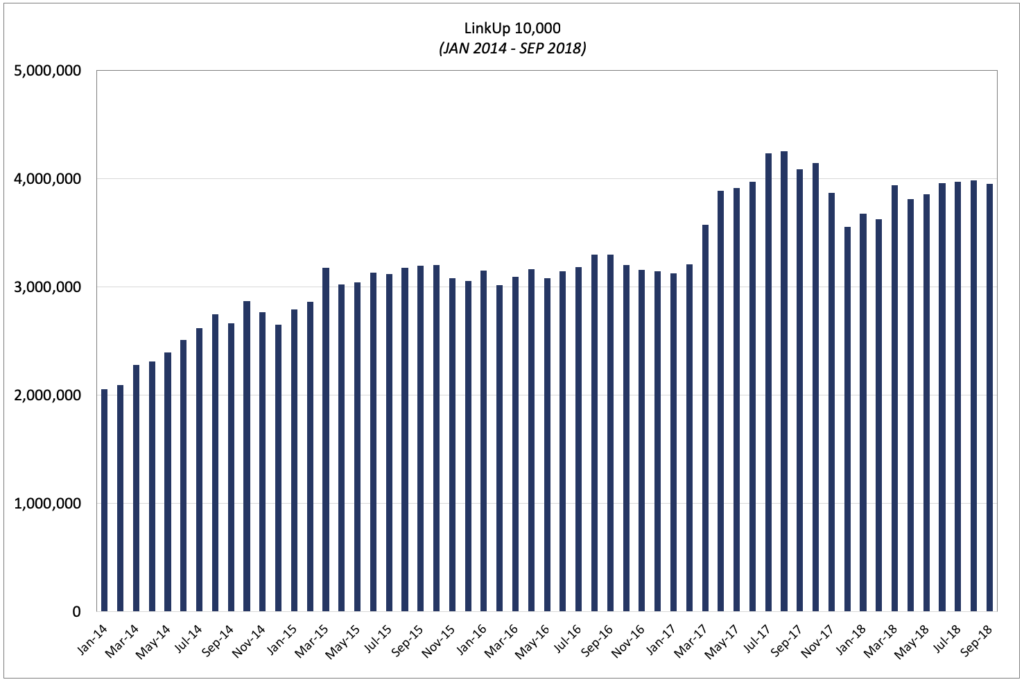
Because we are constantly adding new companies to the dataset, both inside and outside the U.S., we created a macro analytic that we call the LinkUp 10,000. Reported both daily and monthly, the LinkUp 10,000 reports the number of job openings on a given day or in a given month from the largest 10,000 employers in the dataset during that period. While the 10,000 companies themselves change from period to period, the number is always fixed to the largest 10,000. in that way, we have normalized the data to take into account the fact that we are always adding new companies to the dataset.
Not surprisingly, the number of job openings in the LinkUp 10,000 also rose between 2014 and 2018, essentially doubling during that time.
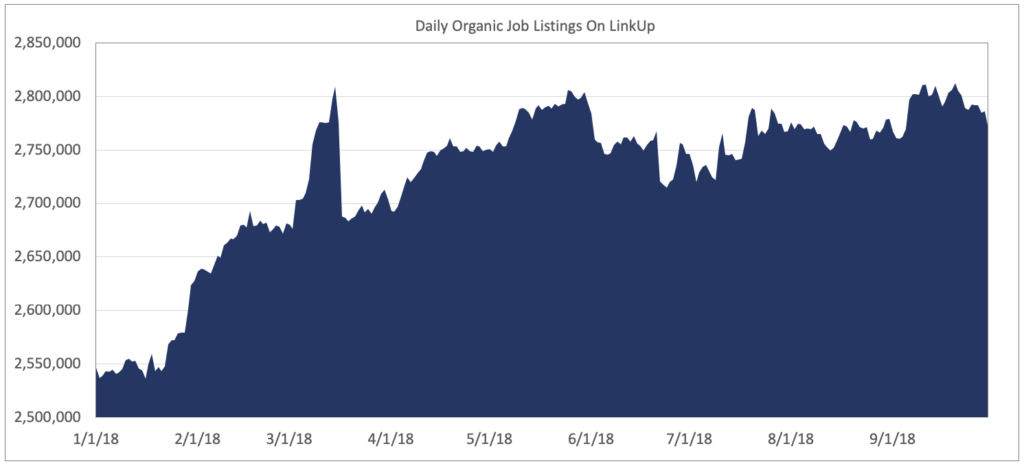
Drilling down into 2018 in more detail, daily job listings have risen approximately 10% over the course of the year, from 2.55 million in January to 2.8 million in September. Relative to the LinkUp 10,000, it is important to keep in mind that the daily job openings is just that – a snapshot of the job count on a given day. The monthly total includes all of the unique jobs that appeared on linkUp in a given month, whether they were on the site for a day or 200 days (and we deploy a variety of very sophisticated techniques to accurately detect unique jobs). Because companies add and remove jobs from their company website every day, total monthly unique jobs will always be higher than daily jobs, and the delta can vary dramatically depending on such factors as the employee churn of each individual company, the company’s industry and location, and the stage of the hiring cycle at a macro level.
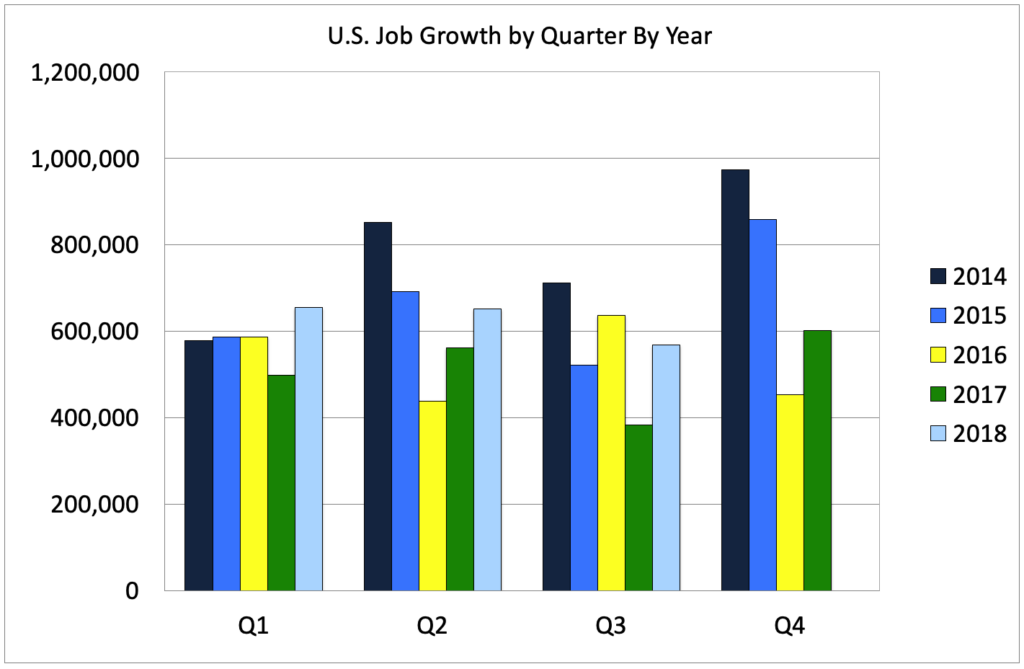
Given the sustained growth in job listings, it is not surprising that job gains have increased from the prior year as evidenced by the chart below which depicts job gains by quarter since 2011.
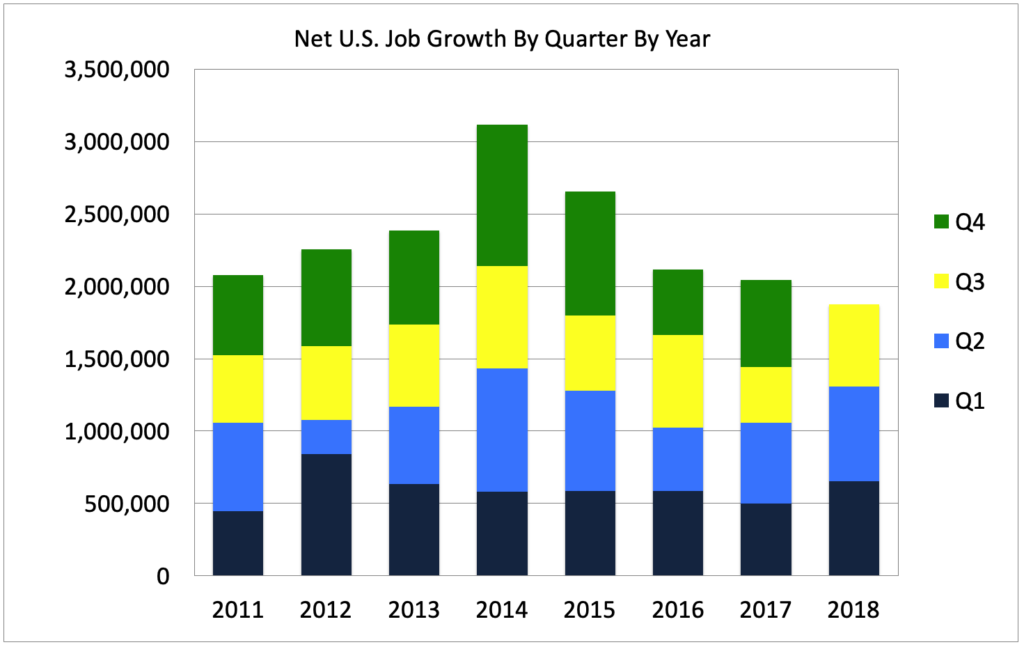
Looking at each quarter individually highlights the extent to which net job gains in each quarter this year have exceeded 2017. We’ll obviously see what happens in Q4, but year-to-date job growth has been surprising to say the least, exceeding consensus forecasts by a wide margin.
Looking ahead to October’s jobs report this Friday, we would normally look at September’s job openings given the fact that a job listing posted on a company’s company website is the best indicator of a future hire being added to the U.S. economy. And because there has historically been a 30-day lag between our data and the BLS data, we look to the prior month to get a sense of hiring in any given month.
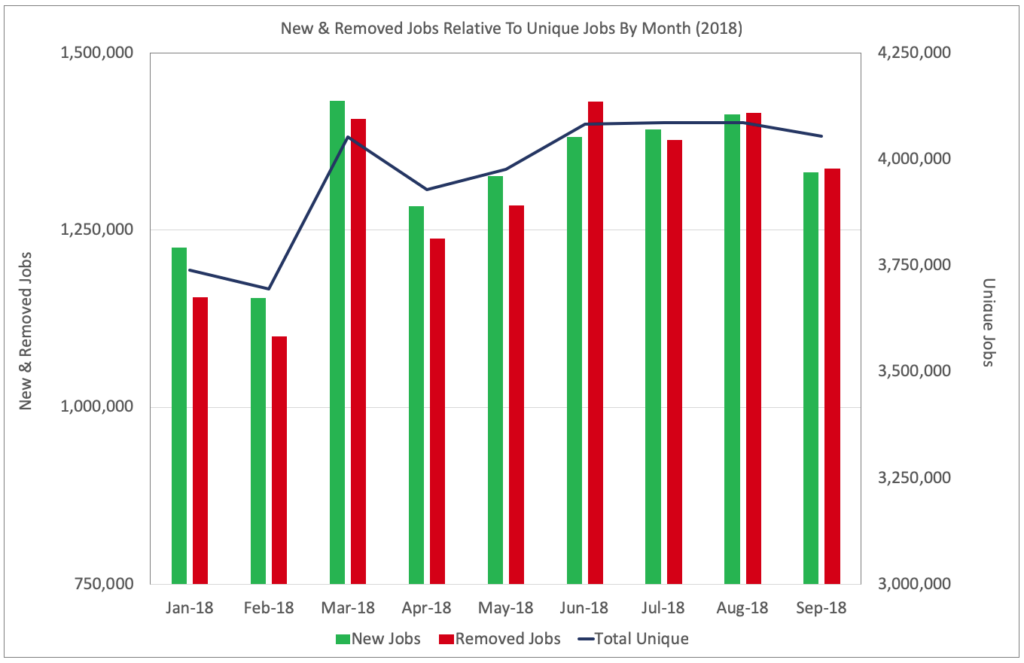
In September, total job openings on LinkUp dropped roughly 1% while new and removed jobs each dropped about 6% from August.
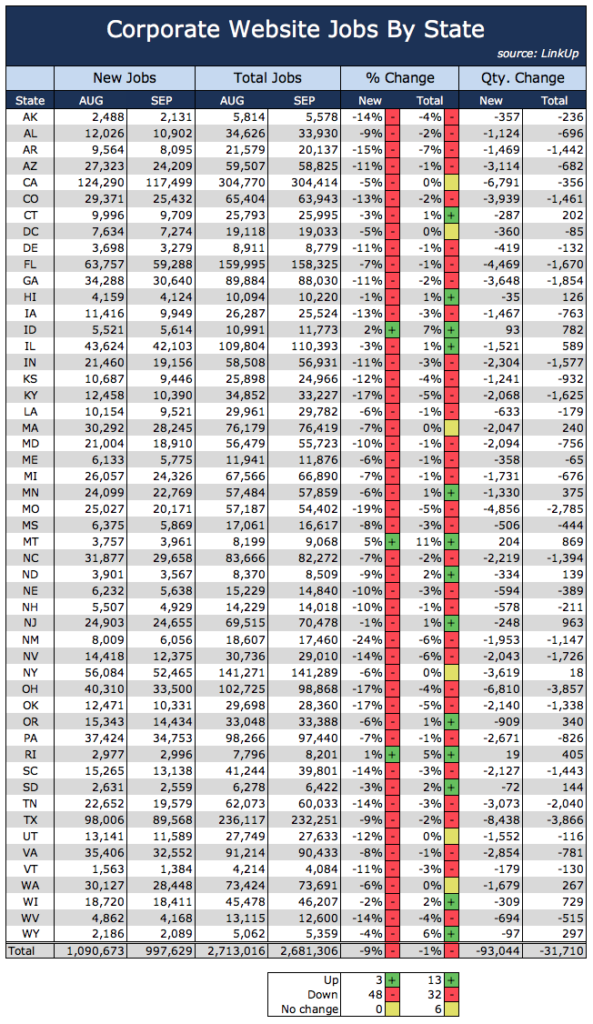
Our paired month data shows a similar decline, with new jobs falling 9% from August and total jobs dropping 1%. Our paired-month methodology is another way we normalize our data to account for the addition of new companies into the index in any given month. In this methodology, we only count jobs from the set of companies that have job openings in both months being evaluated.
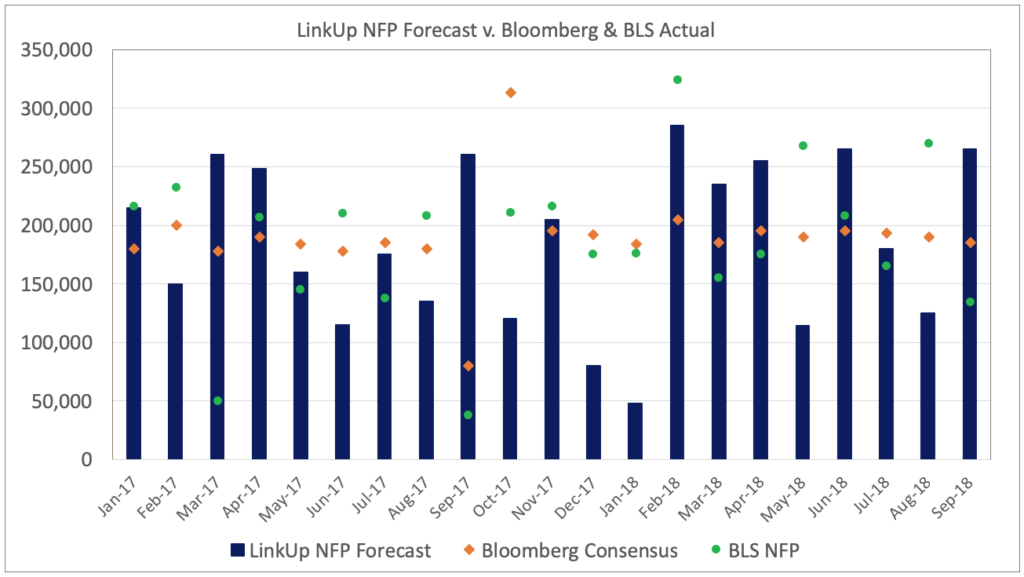
Based on the data above and using our NFP forecasting model, we would normally forecast a net gain of just 45,000 jobs in October. But because our forecasting results this year have been somewhat mediocre, we spent some time this past month reexamining our model and are evaluating some potential tweaks. On the YTD results, we have only called 4 of 9 periods correctly – a ‘batting average’ of .444. This compares to our historical average of 7 of 12 months or an average of .583 (and for hyper-anal readers looking at the data below, we gave ourselves a ‘hurricane adjustment’ last year which resulted in accurate calls in 6 of 11 months for a batting average of .545).
In any event, what jumped out quickly from our analysis was that job duration had dropped from over 55 days in January to 43 days in September. Our Job Duration analytics measures how long a job stays on a company’s career portal before it is filled with a hire and removed from the company’s site. Job Duration is essentially a direct proxy for Time-to-Fill’ in Talent Acquisition speak.
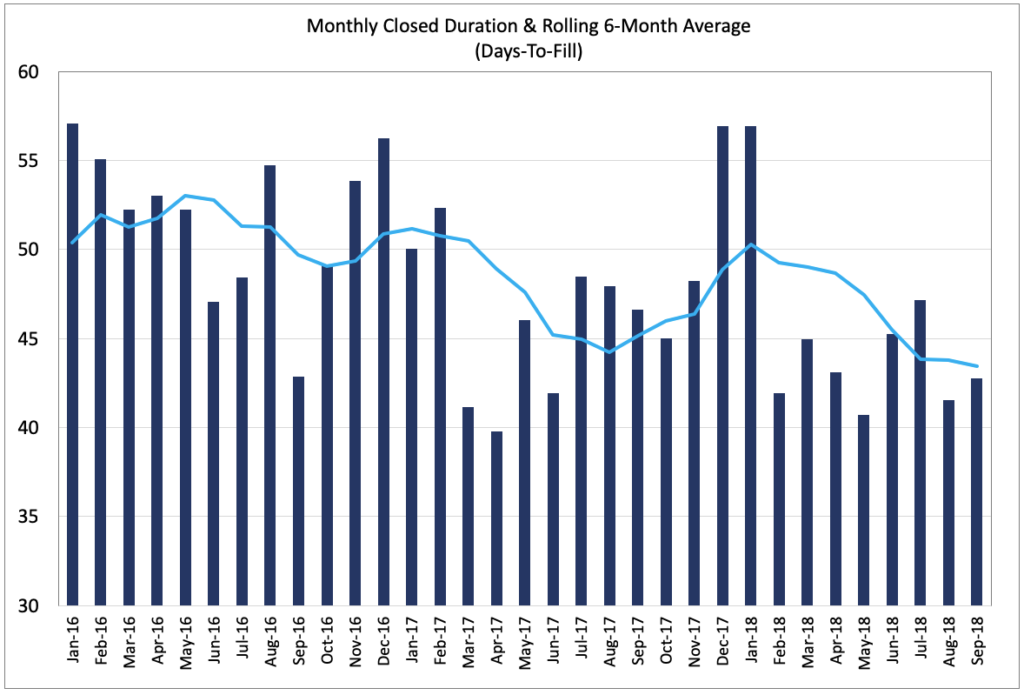
Job Duration has been dropping steadily all year as companies race to fill positions in a ferociously tight job market where for many positions the only requirement is now fogging a mirror. As we wrote in a blog post last week, duration has dropped roughly 20% this year. In our baseline model, we have used a 30-day lag between our data in a given month and non-farm payrolls in the following month and have been overly cautious in adjusting this lag period too frequently. But the current job market is clearly unlike anything we’ve seen in decades, and the velocity of hiring has undoubtedly accelerated dramatically.
If we used the change in a given month to calculate job gains in that same month beginning in May (when Job Duration reached a 12-month low), as depicted in the chart below, we would have forecasted accurately, at least directionally, non-farm payrolls in the past 5 months. (It’s so much easier to forecast the past than the future, especially when you can ignore every rule of statistical modeling).
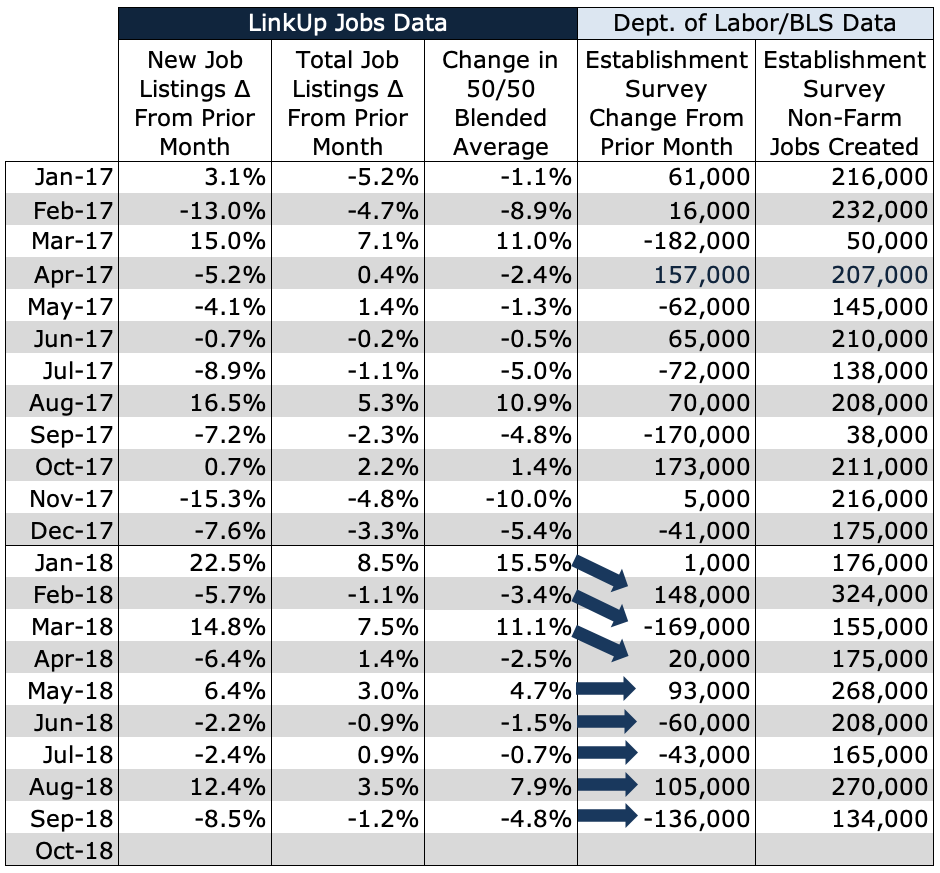
So ignoring the absurdity of the retrofitted methodology we applied to get a perfect streak for the past 5 months, there is validity to the fact that job duration is falling as the pace or velocity of hiring continues to accelerate. And while we may or may not adjust the lag-time in our forecasting model going forward, we most definitely want to look at the data for the entire month of October (which gets processed every month by 5AM on the 1st of each month) before we forecast October’s non-farm payrolls. And in fact, it was the case until recently that we always waited until after the 1st of the month to publish our NFP forecast. While that presented some challenges when the 1st of the month fell on the Friday that the BLS published its jobs report, it did give us the ability to look at the most recent data we had available to us.
So in any event, we are going to issue our NFP forecast for October on Thursday morning, November 1st, no later than 10AM CST.
Insights: Related insights and resources
-
Blog
04.04.2017
LinkUp Forecasting Net Job Growth of 260,000 in March
Read full article -
Blog
07.07.2016
The Full Employment, Healthy Tortoise U.S. Economy Should Add 50,000 Jobs In June
Read full article -
Blog
03.03.2016
LinkUp Forecasting Decent Job Gains In February
Read full article
Stay Informed: Get monthly job market insights delivered right to your inbox.
Thank you for your message!
The LinkUp team will be in touch shortly.
