April 2023 Jobs Recap: Labor demand declines across most industries and occupations
After the 6.0% increase in active job listings in March, April saw a decrease of 2.6% in active job listings.

April Jobs Recap |
 |
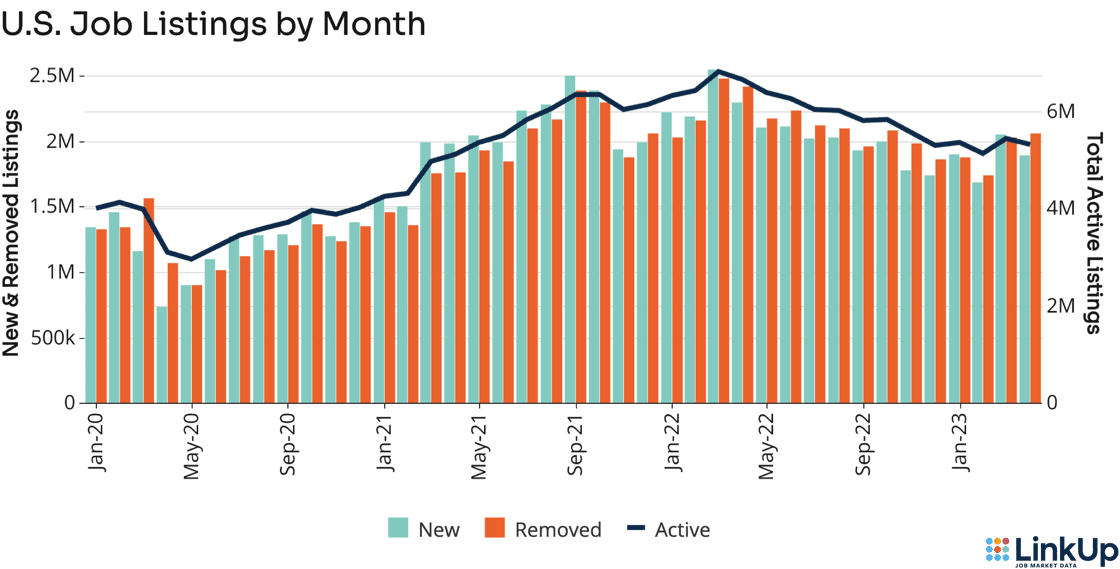
U.S. Job Listings by MonthAfter the 6.0% increase in active job listings in March, April saw a decrease of 2.6% in active job listings indexed directly from company websites. LinkUp data shows new job listings declined by 7.8% in April, down from the 21.6% jump seen in March. Removed job listings increased in April by 1.5%, but nowhere near the March level of 21.7%. The volatility in both new and removed job listings thus far in 2023 reflects the uncertainty in the macroeconomic environment. Employers are trying to balance signs of recession with a tight labor market, significant inflation, and rising interest rates. Overall job openings are high relative to labor supply, but there is a trend toward normalization. |
 |
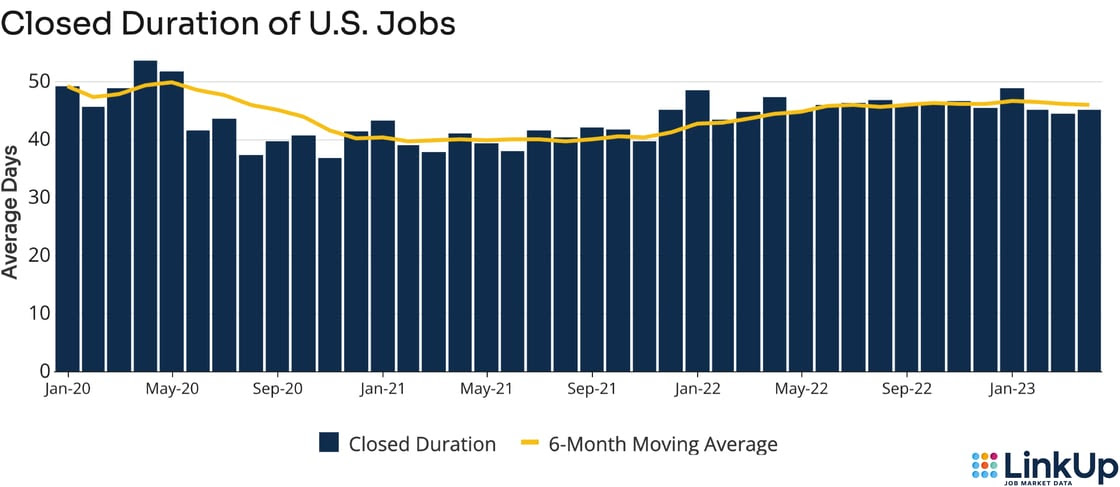
CLOSED DURATIONClosed duration, or the average number of days job listings are posted on company websites before they are removed, tracks hiring velocity across the entire U.S. economy. As the average number of days a job listing remains live increases, hiring velocity slows. |
Listings removed in April remained open for an average of 45.0 days; 1.6% longer than the 44.3 day average of listings removed in March. This decrease in hiring velocity is still below this year’s high in January which was an average of 48.7 days. |
 |
JOBS DATA BY STATE |
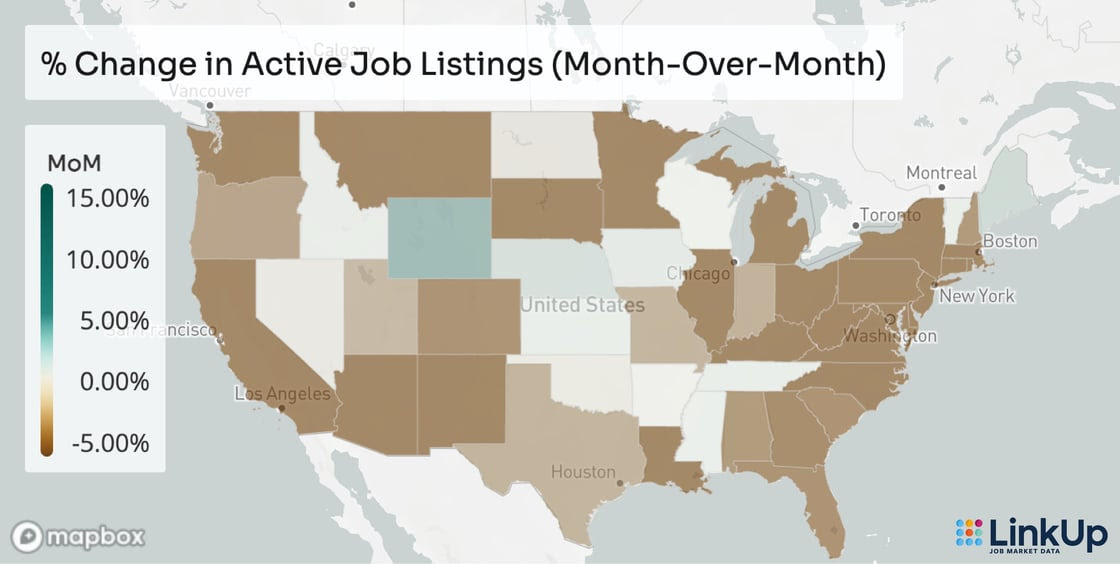
Most states (75%) experienced declining labor demand during April. The states experiencing the largest decreases in active job listings include:
Wyoming (6.7%) and Alaska (6.2%) had the largest increases in labor demand. |
 |
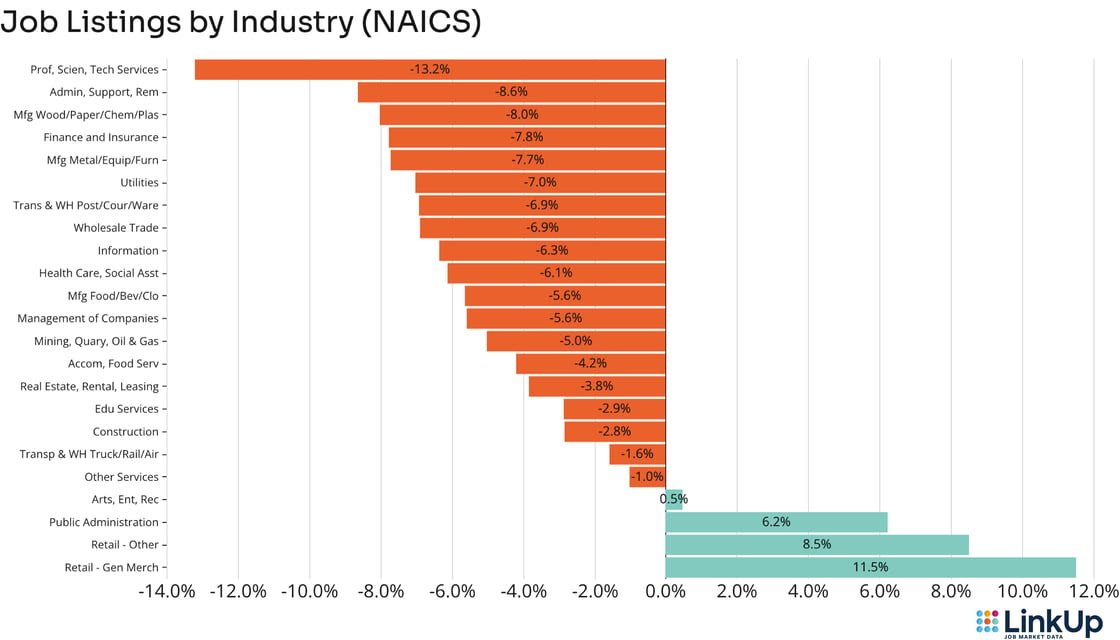
JOBS DATA BY INDUSTRY (NAICS) |
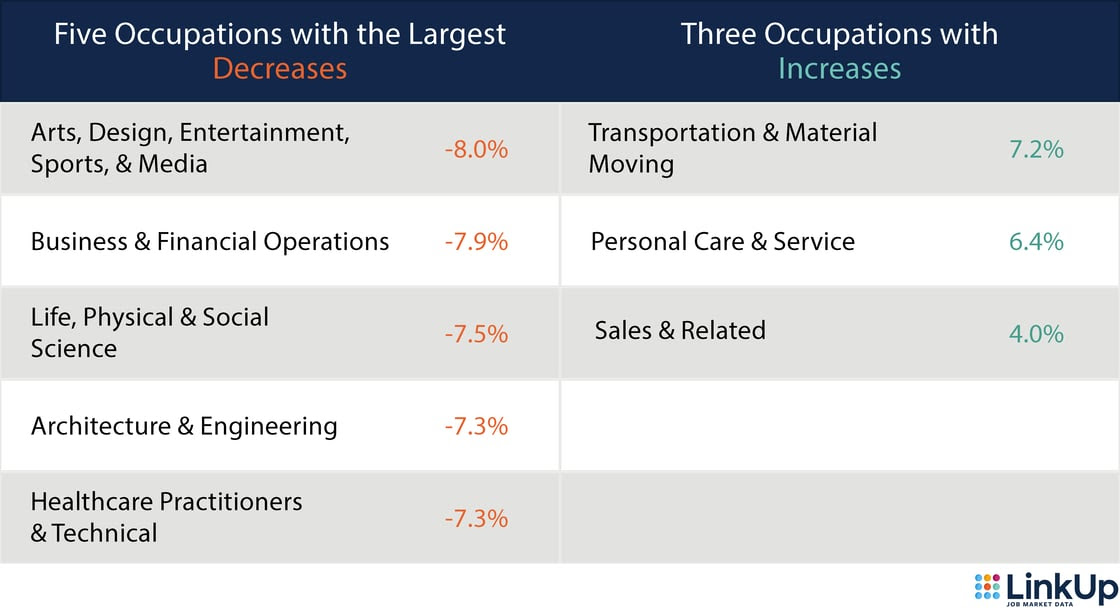
Nearly all industries (83%) saw a decrease in labor demand. The following industries experienced the greatest decline during April:
The only industries that experienced growing labor demand in April were:
|
 |
|
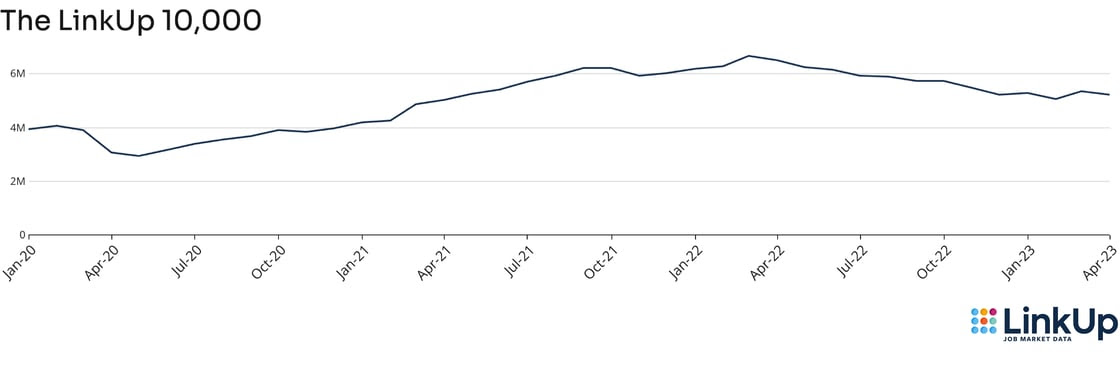
LINKUP 10,000The LinkUp 10,000 is an analytic published daily and monthly that captures the total U.S. job openings from 10,000 global employers in LinkUp’s jobs dataset with the most U.S. job openings. |
In step with observed U.S. labor market activity, the LinkUp 10,000 – tracking U.S. job vacancies for the 10,000 global employers with the most openings in the U.S. – declined 2.6% in April. |
 |
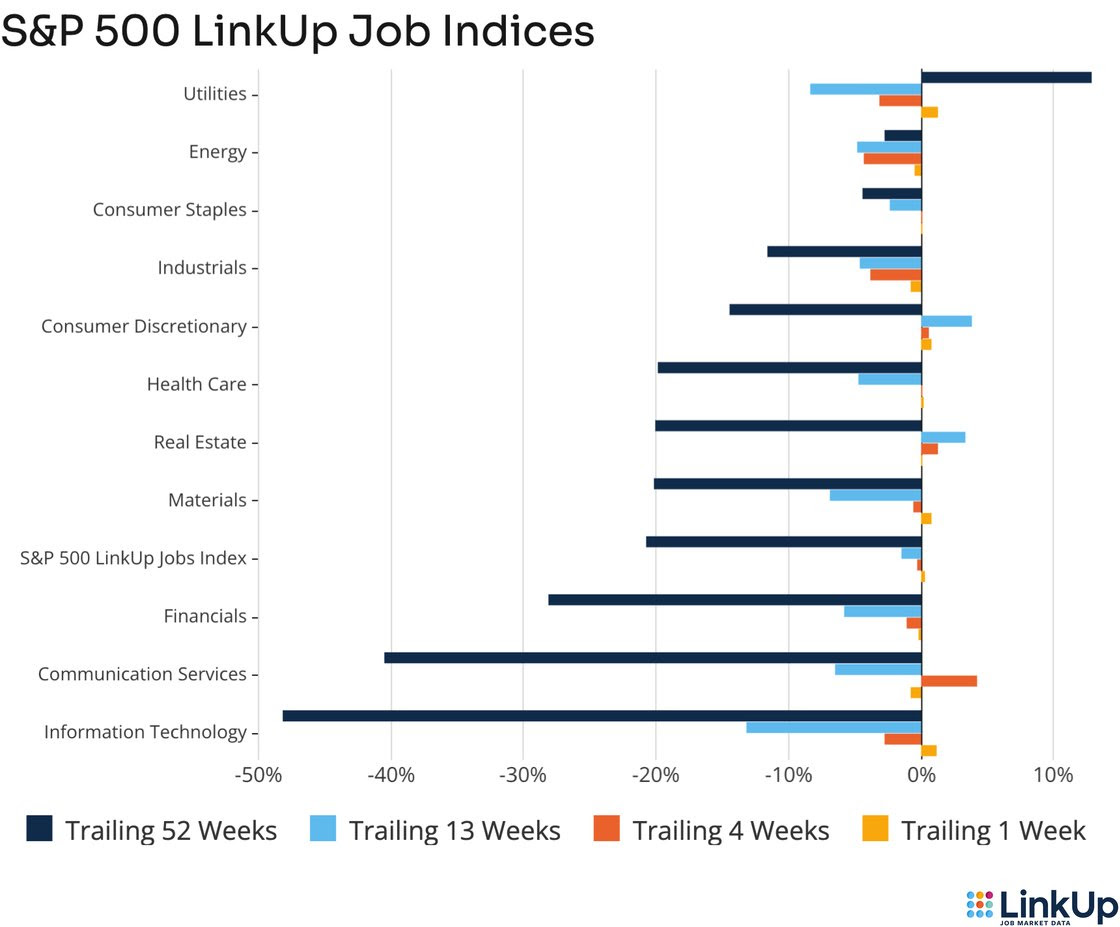
S&P 500 LINKUP JOBS INDEXThe S&P 500 LinkUp Jobs Index is designed to measure open jobs posted by the companies in the S&P 500 and is published on the S&P website. It can be viewed in aggregate or by sector. |
The S&P 500 LinkUp Jobs Index shows listings were down just 0.3% month-over-month overall, with declines across the majority of sectors but gains for:
Those sectors experiencing the largest drops in labor demand were:
|
 |
Data Disclaimer LinkUp’s monthly data recaps incorporate revisions to previously-reported monthly data with the purpose of reporting the most accurate and up-to-date data points. For more information on what circumstances may impact data revisions, visit our Data Support Center. |
Insights: Related insights and resources
-
Blog
04.02.2023
LinkUp Forecasting Net Gain of 460,000 Jobs In March; Strong Job Growth Would Mark Continued Progress for the Most Glorious of Soft Landings
Read full article -
Blog
03.15.2023
LinkUp’s February 2023 JOLTS Forecast
Read full article -
Blog
03.01.2023
LinkUp Forecasting Strong Job Gains in February Even As Labor Demand Continues to Decline
Read full article
Stay Informed: Get monthly job market insights delivered right to your inbox.
Thank you for your message!
The LinkUp team will be in touch shortly.

